. 2007 Feb;9(1):70-9.
doi: 10.2353/jmoldx.2007.060004.

Successful application of microarray technology to microdissected formalin-fixed, paraffin-embedded tissue

Affiliations

Successful application of microarray technology to microdissected formalin-fixed, paraffin-embedded tissue

Renata A Coudry et al. J Mol Diagn. 2007 Feb.

Abstract

The establishment of a reliable method for using RNA from formalin-fixed, paraffin-embedded (FFPE) tissue would provide an opportunity to obtain novel gene expression data from the vast amounts of archived tissue. A custom-designed 22,000 oligonucleotide array was used in the present study to compare the gene expression profile of colonic epithelial cells isolated by laser capture microdissection from FFPE-archived samples with that of the same cell population from matched frozen samples, the preferred source of RNA. Total RNA was extracted from FFPE tissues, amplified, and labeled using the Paradise Reagent System. The quality of the input RNA was assessed by the Bioanalyzer profile, reverse transcriptase-polymerase chain reaction, and agarose gel electrophoresis. The results demonstrate that it is possible to obtain reliable microarray data from FFPE samples using RNA acquired by laser capture microdissection. The concordance between matched FFPE and frozen samples was evaluated and expressed as a Pearson's correlation coefficient, with values ranging from 0.80 to 0.97. The presence of ribosomal RNA peaks in FFPE-derived RNA was reflected by a high correlation with paired frozen samples. A set of practical recommendations for evaluating the RNA integrity and quality in FFPE samples is reported.


Figures

Figure 1
Figure 1
Representative LCM images of colonic malignant epithelial cells captured from H&E-stained sections. a: Images of the tissue before capture. b: Cells marked for capture. c: Pure population of captured cells in the cap. d: Remaining tissue after capture.
Figure 2
Figure 2
Comparative analysis of total RNA obtained by LCM and from scraped tissue. One microliter of RNA extracted from frozen or FFPE tissue was loaded on a Bioanalyzer Pico RNA Chip and fractionated in an Agilent Bioanalyzer 2100. 18S and 28S ribosomal RNA peaks are observed in all samples, and no difference is observed between laser capture microdissected (large panels) and scraped specimens (small panels). RNA recovered from FFPE samples exhibits a more heterogeneous profile, and ribosomal RNA peaks are broadened. Samples were processed immediately (0 hour) on arrival from surgery or after a delay of 2 hours. There is a discrete level of RNA degradation in tissues where freezing was delayed 2 hours.
Figure 3
Figure 3
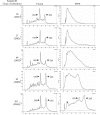
Electropherogram of total RNA obtained from cells following LCM. RNA extracted from LCM FFPE or frozen tissue was loaded on a Bioanalyzer Pico RNA Chip and fractionated in an Agilent Bioanalyzer 2100. Sample number and year of collection are indicated on the left side. 18S and 28S ribosomal RNA peaks are observed in RNA derived from all frozen tissues and also in sample 201-FFPE. In contrast, there is a lack of ribosomal peaks in most of the FFPE samples. The profile in the FFPE samples varies from a sharp peak to a large plateau; the first indicates a prevalence of small size RNA fragments (samples 26 and 27), and the second indicates a greater variety of fragment sizes (samples 201, 62, and 68).
Figure 4
Figure 4
Evaluation of aRNA. A: One microgram of aRNA derived from FFPE/frozen samples and Human Reference RNA BD Clontech (Ref), all used for microarray hybridizations, was fractionated on a 2% agarose gel stained with ethidium bromide. The average length observed for frozen tissue-derived aRNAs was slightly longer (∼500 bases) than that derived from FFPE tissue (∼400 bases). Sample 201-FFPE, which exhibited ribosomal RNA peaks, shows the highest aRNA length among the other FFPE samples. The yield obtained for each aRNA is indicated below each lane. B: RT-PCR was used to evaluate the fragment length of aRNA from matched frozen and FFPE samples (24, 26, 27, 62, and 68). A control RNA provided in the Paradise system (C) was also evaluated. aRNA (250 ng) was reverse transcribed and amplified using primers specific for β-actin (HBAC), N-acetyltransferase 1 (NAT-1), and cytokeratin 20 (KRT20) and located within 700 bp of the 3′ region of the mRNA sequence. The position of each amplicon relative to the mRNA sequence is pictured at the bottom.
Figure 5
Figure 5
Scatter plots show the correlation based on ratios of genes expressed in both frozen and FFPE tissues. Expressed genes are defined as spots that are not flagged as saturation and nonuniformity outliers and are positive and significantly above background in both the Cy3 and Cy5 channels; the P value of the ratio is less than 0.05. The total number of expressed genes and the correlation value (R) for each pair of matched samples are indicated. Nonexpressed genes are excluded from the plots (shown by the empty area in the center of the scatter plots). Lines correspond to the 45° diagonal line and ±1 ratio unit lines (10-fold difference between frozen and FFPE samples).

References

    1. Elkahloun AG, Gaudet J, Robinson GS, Sgroi DC. In situ gene expression analysis of cancer using laser capture microdissection, microarrays and real time quantitative PCR. Cancer Biol Ther. 2002;1:354–358. - PubMed
    1. Lehmann U, Kreipe H. Real-time PCR analysis of DNA and RNA extracted from formalin-fixed and paraffin-embedded biopsies. Methods. 2001;25:409–418. - PubMed
    1. Ramaswamy S. Translating cancer genomics into clinical oncology. N Engl J Med. 2004;350:1814–1816. - PubMed
    1. Masuda N, Ohnishi T, Kawamoto S, Monden M, Okubo K. Analysis of chemical modification of RNA from formalin-fixed samples and optimization of molecular biology applications for such samples. Nucleic Acids Res. 1999;27:4436–4443. - PMC - PubMed
    1. Soguero C, Ribalta T, Campo E, Sanchez-Tapies JM, Saiz JC, Bruguera M. Detection of hepatitis C virus RNA in more than 20-year-old paraffin-embedded liver tissue. Lab Invest. 1999;79:365–366. - PubMed

Publication types