. 2007 Feb;48(2):949-56.
doi: 10.1167/iovs.06-0734.

Human infants' accommodation responses to dynamic stimuli

Affiliations

Human infants' accommodation responses to dynamic stimuli

Grazyna M Tondel et al. Invest Ophthalmol Vis Sci. 2007 Feb.

Abstract

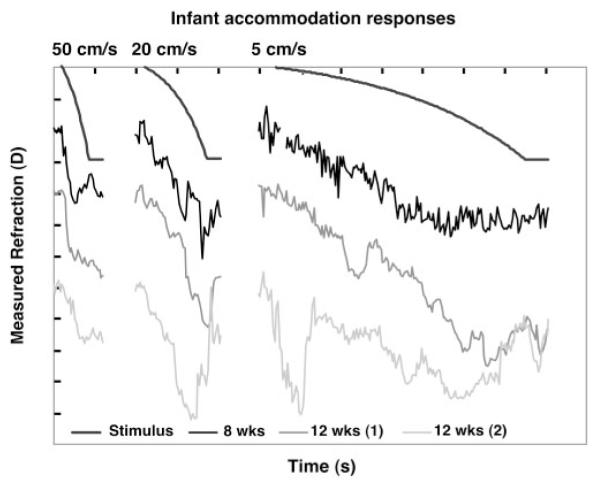
Purpose: A young infant's environment routinely consists of moving objects. The dynamics of the infant accommodative system are almost unknown and yet have a large impact on habitual retinal image quality and visual experience. The goal of this study was to record infants' dynamic accommodative responses to stimuli moving at a range of velocities.

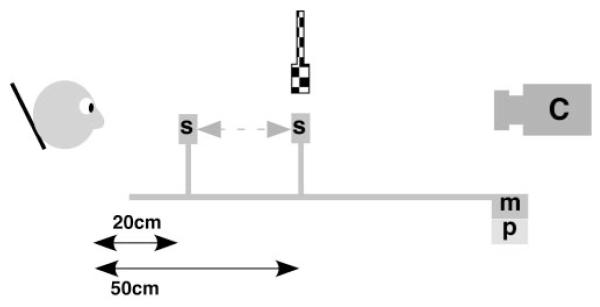
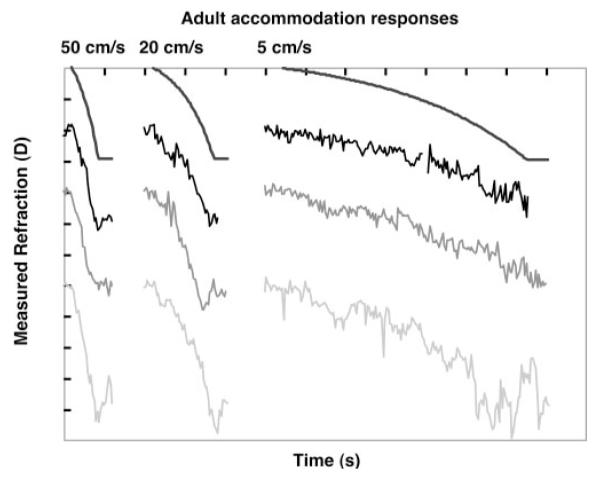
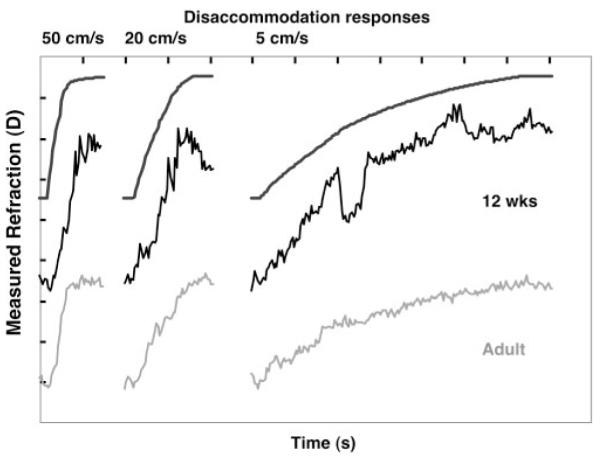
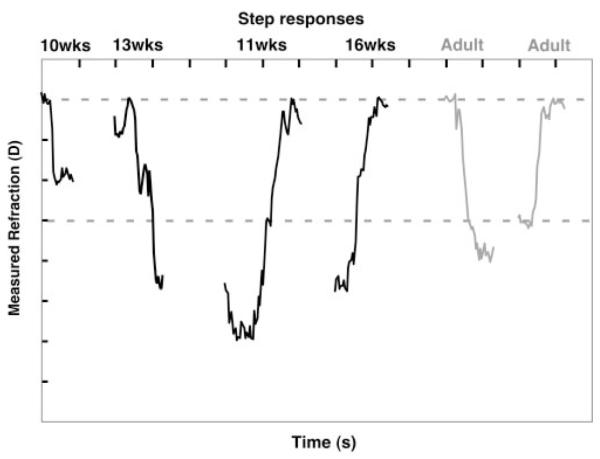
Methods: Binocular accommodative responses were recorded at 25 Hz. Data from infants 8 to 20 weeks of age and pre-presbyopic adults were analyzed. A high-contrast image of a clown was moved between 20- and 50-cm viewing distances at four velocities (a step, 50 cm/s, 20 cm/s, and 5 cm/s).

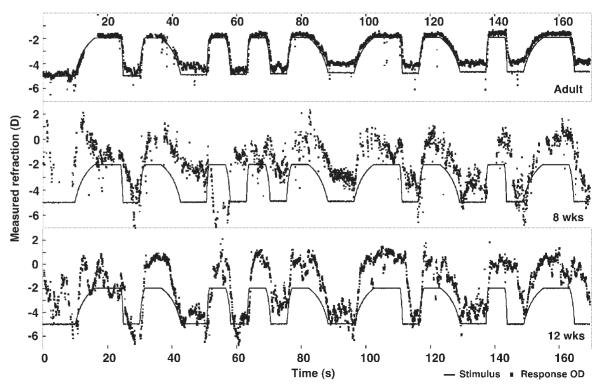
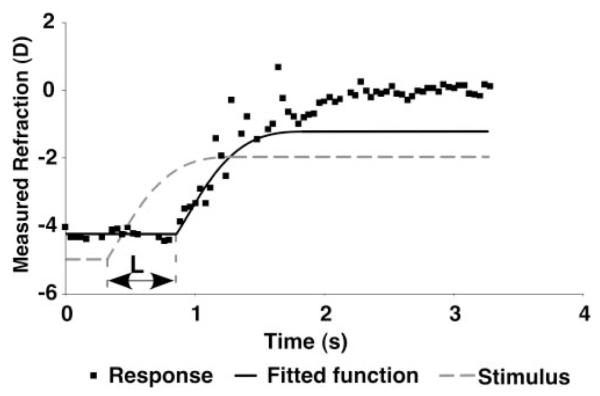
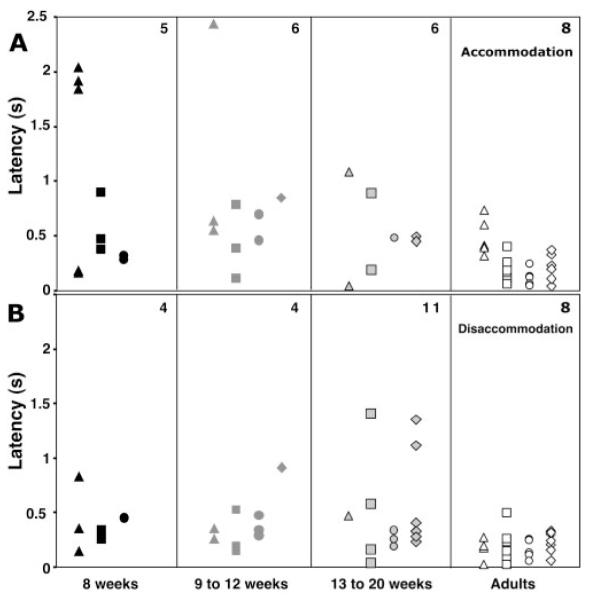
Results: Most infants who had clear responses were able to initiate their response within a second of stimulus onset. The infants were able to discriminate the different stimulus velocities and to adjust their response velocities and durations in an appropriate fashion.

Conclusions: The data indicate that by the third postnatal month infants are able to respond with latencies within a factor of two of adults' and that there is little immaturity in the motor capabilities of the accommodative system compared with the sensory visual system at the same age.


Figures

Figure 1
Figure 1
Schematic of the experimental apparatus. For the ramp protocol, the stimulus, S, was moved by a motor, m, along a track in front of the stabilized subject. The movement was recorded using a linear potentiometer, p, which was synchronized with the video recorded by the photorefractor camera, C. The target was moved from a viewing distance of 20 cm to a viewing distance of 50 cm from the subject (a 30-cm movement) to present the disaccommodative stimulus and in the opposite direction for the accommodative stimulus. For the step protocol, the stimulus, S, was fixed at 20 cm from the subject, and a second fixed stimulus was introduced above the camera axis at 50 cm, as represented by the checkered version. These stimuli were alternately illuminated using a toggle switch that was also synchronized with the output of the camera, C.
Figure 2
Figure 2
Raw data from the entire ramp session recorded from an adult (top), an 8 week-old infant (middle), and a 12 week-old infant (bottom). The black line represents the stimulus position as a function of time, which was the same for each subject. Data from the left and right eyes were so similar that only data from each right eye are plotted for clarity. Raw photorefractor data (collected at a viewing distance of 1 m) were shifted by 1 D to make the stimulus position of 0 in this figure equal to infinity. The 50-cm viewing distance therefore corresponds to a value of −2 D in the figure and the 20-cm distance to −5 D.
Figure 3
Figure 3
An example of the fit to the data used to calculate the latency of a response. The dashed line function represents the fit to the potentiometer stimulus data (equation 1). The solid line represents the fit of the first section of the stimulus function to the response data, with the rest of the stimulus function added after the fit. The amount of the stimulus function used was adjusted to achieve a visually acceptable fit. The latency (L) of the response was calculated by taking the difference between the beginning of the stimulus and the response, as shown.
Figure 4
Figure 4
Adult responses to the ramp accommodative stimuli of different velocities. Each gray level represents a different adult, shifted vertically for clarity. The smooth black functions represent the stimuli for comparison (with the beginning of the stimulus and response aligned). Each unit on the y-axis represents 1 D, and on the x-axis it represents 1 second.
Figure 5
Figure 5
Infant responses to the ramp accommodative stimuli of different velocities. Each gray level represents a different infant whose age is shown at the bottom of the figure. The format is the same as for Figure 4.
Figure 6
Figure 6
Responses to the ramp disaccommodative stimuli from one adult and one 12-week-old infant. The format is the same as for Figure 4.
Figure 7
Figure 7
Responses to the step stimuli from one adult and a number of infants of different ages. The amplitude of the stimulus is represented by the dashed lines. Otherwise, the format is the same as for Figure 4. Successful step responses, as defined in the data analysis section, were collected from 10 infants of 10 to 19 weeks of age (from a total of 41 attempts).
Figure 8
Figure 8
Latencies of individual responses as a function of stimulus direction, age, and stimulus velocity. (A) Latencies for the accommodative responses. (B) Latencies for the disaccommodative responses. Data are grouped as a function of age as shown on the x-axis. Each data point represents the latency for one subject. Top right: number of subjects contributing points; triangles: data for the 5-cm/s condition; squares: data for the 20-cm/s condition; circles: data for the 50-cm/s condition; diamonds: data for the step condition. With this apparatus it was easier, based on anecdotal evidence, to elicit responses from infants in the ramp protocol than in the step protocol.

References

    1. Sur M, Leamey CA. Development and plasticity of cortical areas and networks. Nat Rev Neurosci. 2001;2:251–262. - PubMed
    1. Troilo D. Neonatal eye growth and emmetropization—a literature review. Eye. 1992;6:154–160. - PubMed
    1. Saunders KJ, Woodhouse JM, Westall CA. Emmetropisation in human infancy: rate of change is related to initial refractive error. Vision Res. 1995;35:1325–1328. - PubMed
    1. Smith EL, 3rd, Hung LF. The role of optical defocus in regulating refractive development in infant monkeys. Vision Res. 1999;39:1415–1435. - PubMed
    1. Cook RC, Glasscock RE. Refractive and ocular findings in the newborn. Am J Ophthalmol. 1951;34:1407–1413. - PubMed

Publication types