

The zinc-binding protein chordc1 undergoes complex diurnal changes in mRNA expression during mouse brain development
- PMID: 17253150
- PMCID: PMC6528676
- DOI: 10.1007/s11064-006-9271-z
The zinc-binding protein chordc1 undergoes complex diurnal changes in mRNA expression during mouse brain development
Abstract
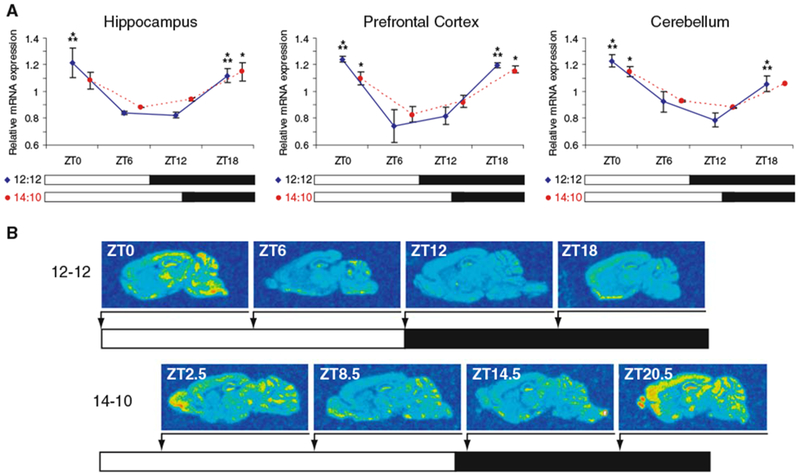
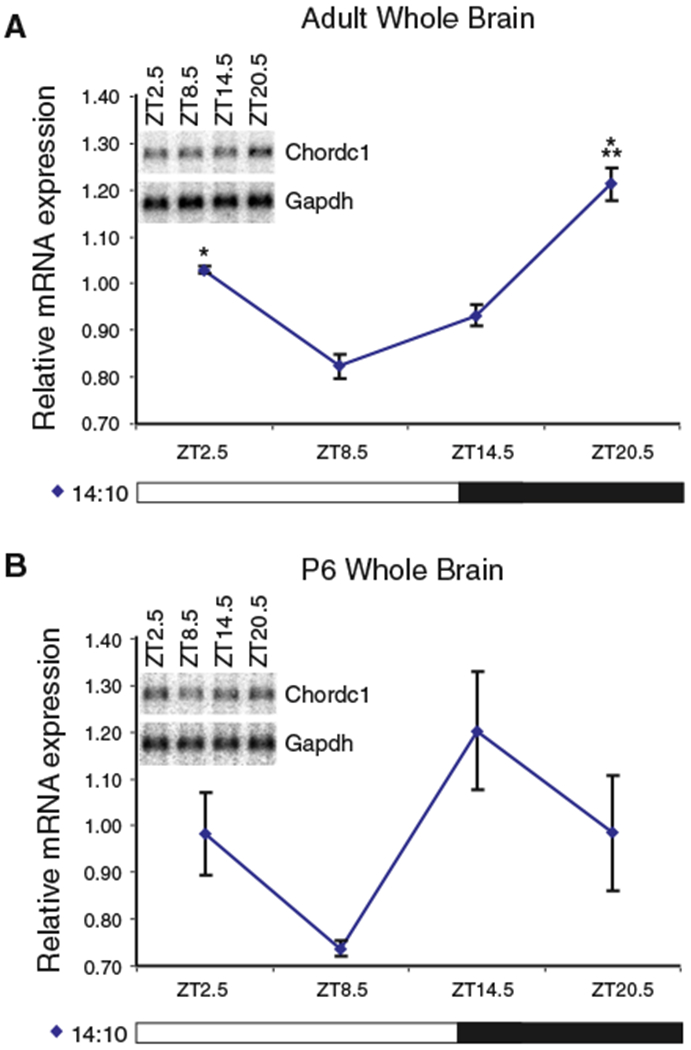
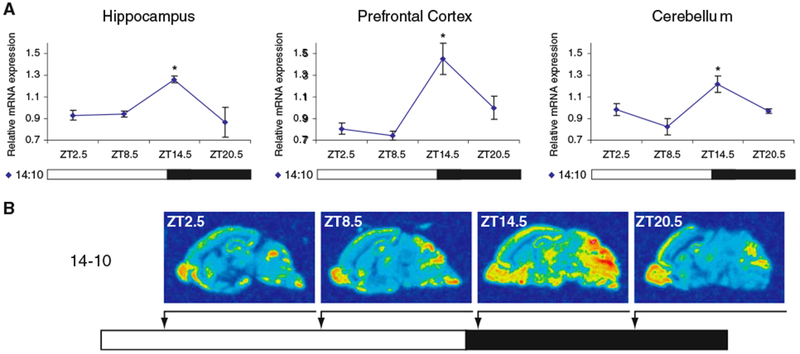
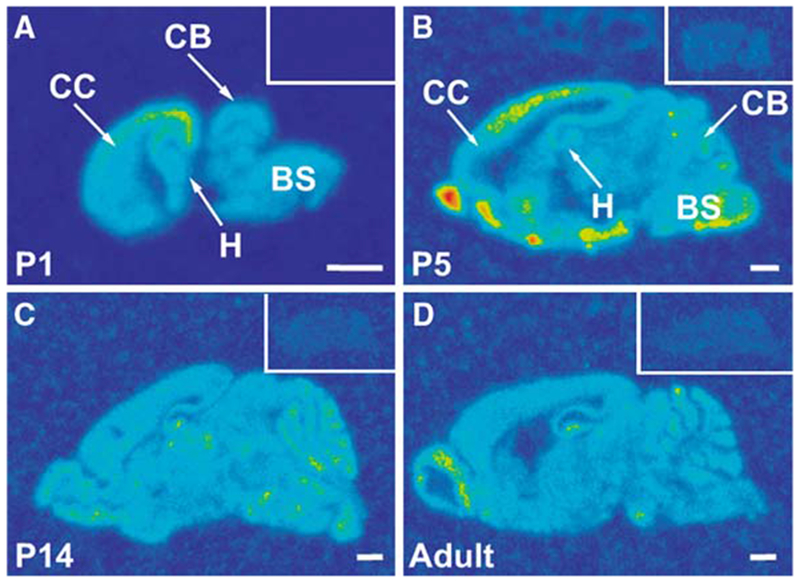
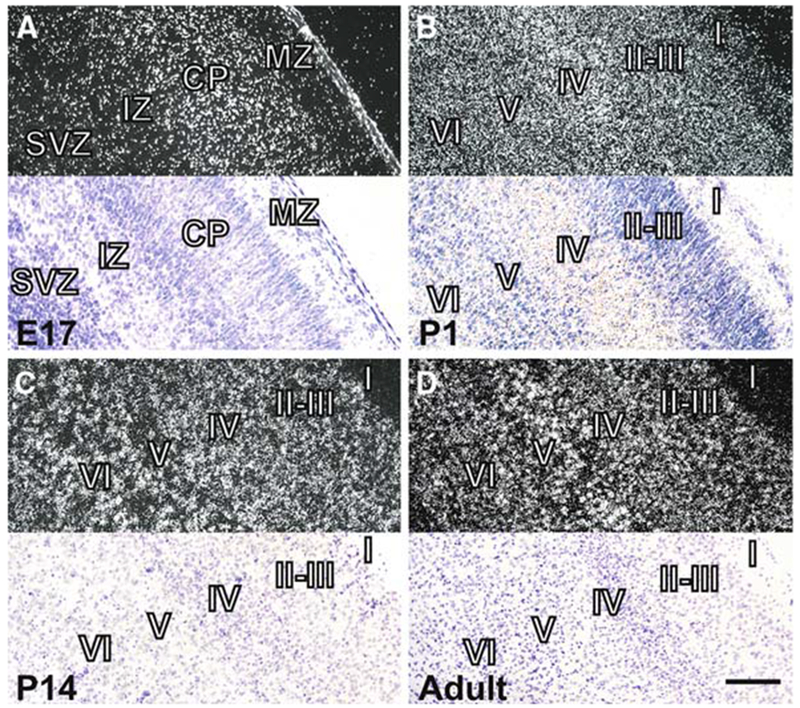
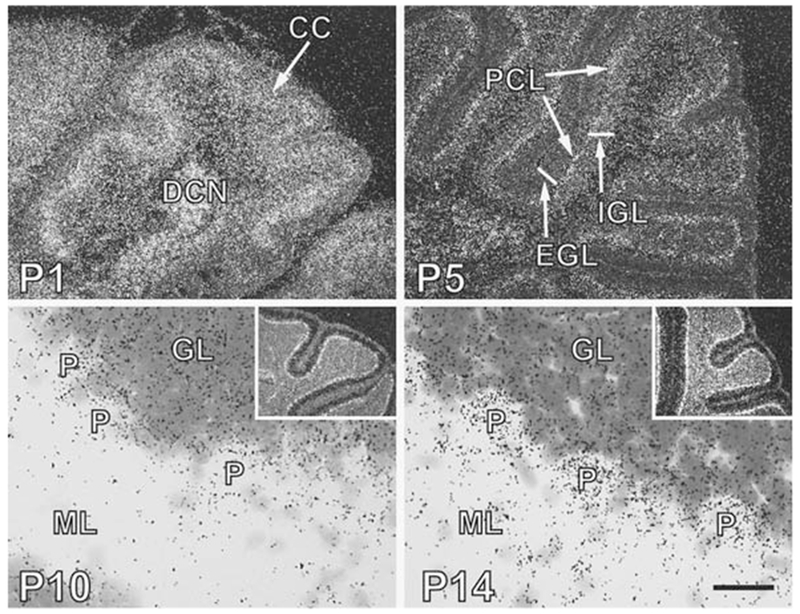
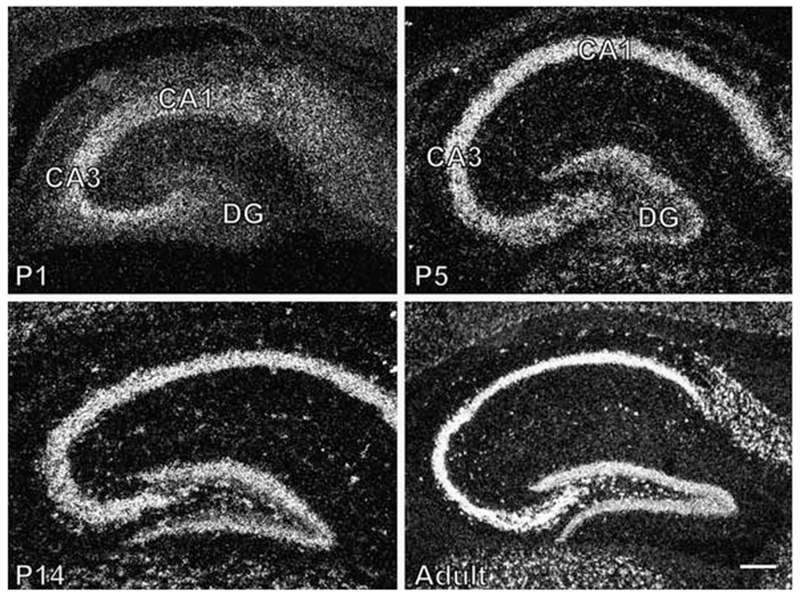
Diurnal changes in Chordc1 mRNA were recently described in mouse hypothalamus. This report shows that Chordc1 mRNA changes rhythmically throughout the entire adult brain with highest expression levels occurring around the dark-light transition. The rhythmic cycling pattern of Chordc1 was retained under various light-dark schedules and analysis of adult whole brain revealed diurnal patterns that were different than young animals (postnatal day (P) 6). Analysis of adult hippocampus, prefrontal cortex and cerebellum confirmed these observations and a comparison between adult and P6 animals using in situ hybridization indicated that Chordc1 underwent coordinated but altered diurnal changes in mRNA abundance during development. Further, a developmental profile of Chordc1 expression beginning at embryonic day 17 revealed a regional distribution of Chordc1 consistent with its adult pattern. These results suggest that Chordc1 mRNA is under complex and widespread transcriptional regulation during development and implicate Chordc1 in circadian and/or homeostatic mechanisms in mammalian brain.
Figures
Similar articles
-
Brain fatty acid binding protein (Fabp7) is diurnally regulated in astrocytes and hippocampal granule cell precursors in adult rodent brain.PLoS One. 2008 Feb 20;3(2):e1631. doi: 10.1371/journal.pone.0001631. PLoS One. 2008. PMID: 18286188 Free PMC article.
-
Localization of GDNF/neurturin receptor (c-ret, GFRalpha-1 and alpha-2) mRNAs in postnatal rat brain: differential regional and temporal expression in hippocampus, cortex and cerebellum.Brain Res Mol Brain Res. 1999 Nov 10;73(1-2):151-71. doi: 10.1016/s0169-328x(99)00217-x. Brain Res Mol Brain Res. 1999. PMID: 10581409
-
Expression of DA11, a neuronal-injury-induced fatty acid binding protein, coincides with axon growth and neuronal differentiation during central nervous system development.J Neurosci Res. 1997 Jun 15;48(6):551-62. doi: 10.1002/(sici)1097-4547(19970615)48:6<551::aid-jnr8>3.0.co;2-9. J Neurosci Res. 1997. PMID: 9210525
-
Sodium channel alpha-subunit mRNAs I, II, III, NaG, Na6 and hNE (PN1): different expression patterns in developing rat nervous system.Brain Res Mol Brain Res. 1997 Apr;45(1):71-82. doi: 10.1016/s0169-328x(96)00241-0. Brain Res Mol Brain Res. 1997. PMID: 9105672
-
Profiles of novel diurnally regulated genes in mouse hypothalamus: expression analysis of the cysteine and histidine-rich domain-containing, zinc-binding protein 1, the fatty acid-binding protein 7 and the GTPase, ras-like family member 11b.Neuroscience. 2006;139(4):1435-48. doi: 10.1016/j.neuroscience.2006.01.020. Epub 2006 Mar 6. Neuroscience. 2006. PMID: 16517089 Free PMC article.
Cited by
-
Insoluble DISC1-Boymaw fusion proteins generated by DISC1 translocation.Mol Psychiatry. 2010 Jul;15(7):669-72. doi: 10.1038/mp.2009.127. Epub 2010 Mar 30. Mol Psychiatry. 2010. PMID: 20351725 Free PMC article. No abstract available.
-
The double face of Morgana in tumorigenesis.Oncotarget. 2015 Dec 15;6(40):42603-12. doi: 10.18632/oncotarget.6058. Oncotarget. 2015. PMID: 26460959 Free PMC article. Review.
-
Brain fatty acid binding protein (Fabp7) is diurnally regulated in astrocytes and hippocampal granule cell precursors in adult rodent brain.PLoS One. 2008 Feb 20;3(2):e1631. doi: 10.1371/journal.pone.0001631. PLoS One. 2008. PMID: 18286188 Free PMC article.
-
Time of day regulates subcellular trafficking, tripartite synaptic localization, and polyadenylation of the astrocytic Fabp7 mRNA.J Neurosci. 2012 Jan 25;32(4):1383-94. doi: 10.1523/JNEUROSCI.3228-11.2012. J Neurosci. 2012. PMID: 22279223 Free PMC article.
-
Long non-coding RNA and alternative splicing modulations in Parkinson's leukocytes identified by RNA sequencing.PLoS Comput Biol. 2014 Mar 20;10(3):e1003517. doi: 10.1371/journal.pcbi.1003517. eCollection 2014 Mar. PLoS Comput Biol. 2014. PMID: 24651478 Free PMC article.
References
-
- Shirasu K, Lahaye T, Tan MW et al. (1999) A novel class of eukaryotic zinc-binding proteins is required for disease resistance signaling in barley and development in C. elegans. Cell 99:355–366 - PubMed
-
- Brancaccio M, Menini N, Bongioanni D et al. (2003) Chp-1 and melusin, two CHORD containing proteins in vertebrates. FEBS Lett 551:47–52 - PubMed
-
- Azevedo C, Sadanandom A, Kitagawa K et al. (2002) The RAR1 interactor SGT1, an essential component of R gene-triggered disease resistance. Science 295:2073–2076 - PubMed
-
- Holt BF 3rd, Belkhadir Y, Dangl JL (2005) Antagonistic control of disease resistance protein stability in the plant immune system. Science 309:929–932 - PubMed
Publication types
MeSH terms
Substances
Grants and funding
LinkOut - more resources
Full Text Sources
Molecular Biology Databases
Research Materials
