. 2007 Jan 25:8:25.
doi: 10.1186/1471-2105-8-25.

Bias in random forest variable importance measures: illustrations, sources and a solution

Affiliations

Bias in random forest variable importance measures: illustrations, sources and a solution

Carolin Strobl et al. BMC Bioinformatics. .

Abstract

Background: Variable importance measures for random forests have been receiving increased attention as a means of variable selection in many classification tasks in bioinformatics and related scientific fields, for instance to select a subset of genetic markers relevant for the prediction of a certain disease. We show that random forest variable importance measures are a sensible means for variable selection in many applications, but are not reliable in situations where potential predictor variables vary in their scale of measurement or their number of categories. This is particularly important in genomics and computational biology, where predictors often include variables of different types, for example when predictors include both sequence data and continuous variables such as folding energy, or when amino acid sequence data show different numbers of categories.

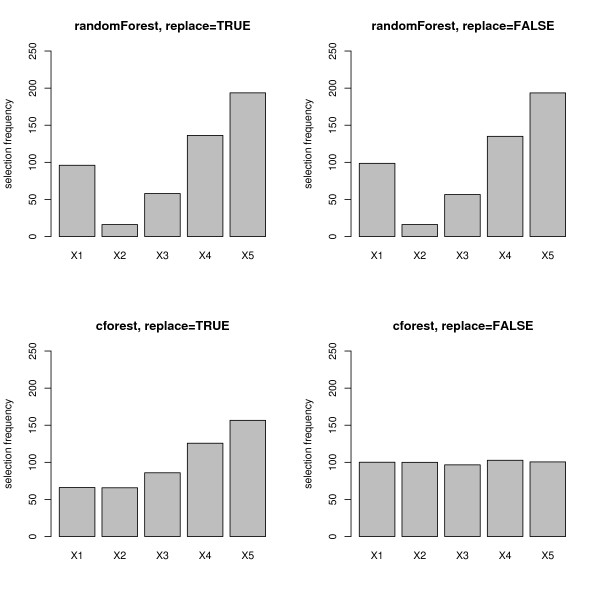
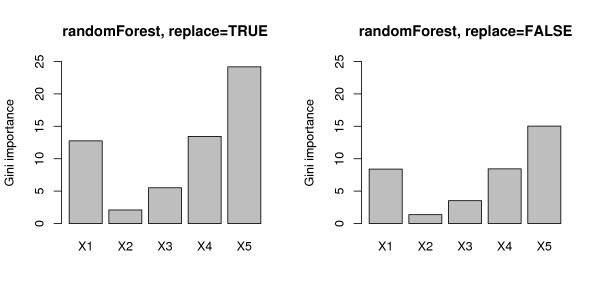
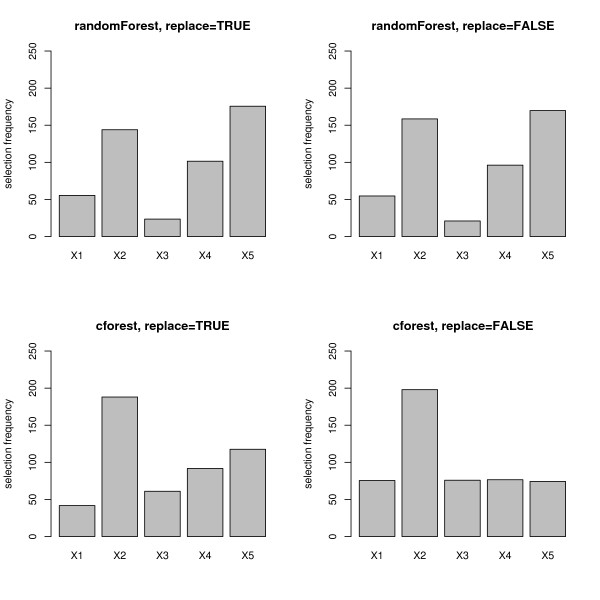
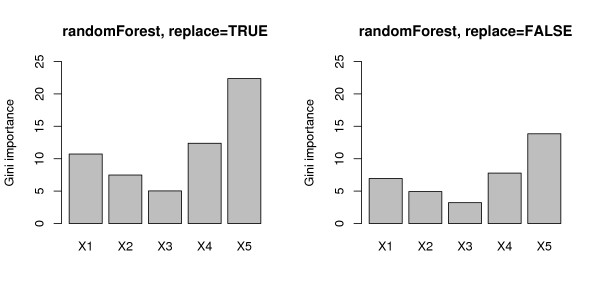
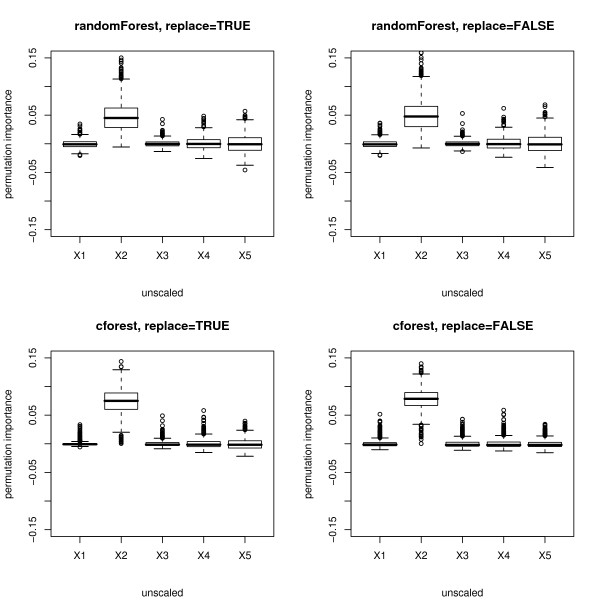
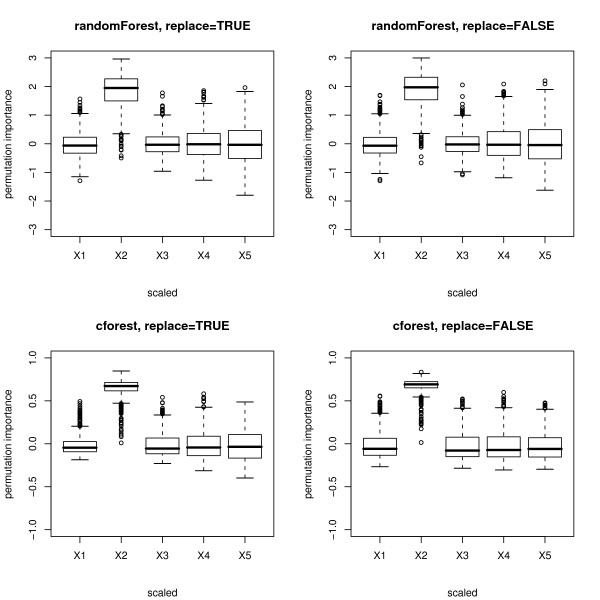
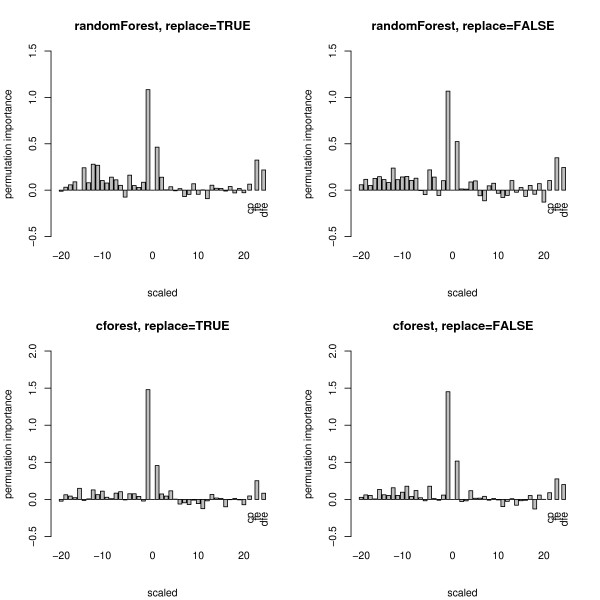
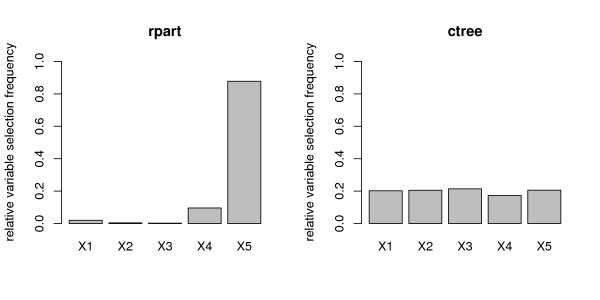
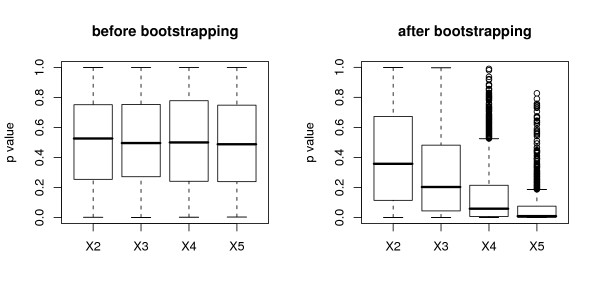
Results: Simulation studies are presented illustrating that, when random forest variable importance measures are used with data of varying types, the results are misleading because suboptimal predictor variables may be artificially preferred in variable selection. The two mechanisms underlying this deficiency are biased variable selection in the individual classification trees used to build the random forest on one hand, and effects induced by bootstrap sampling with replacement on the other hand.

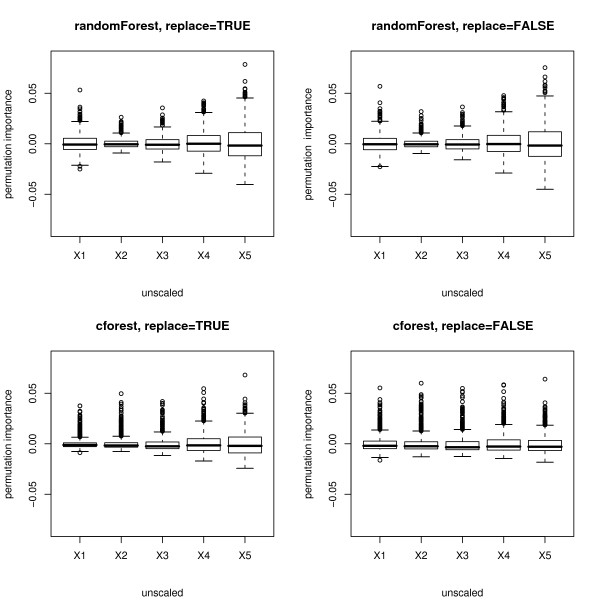
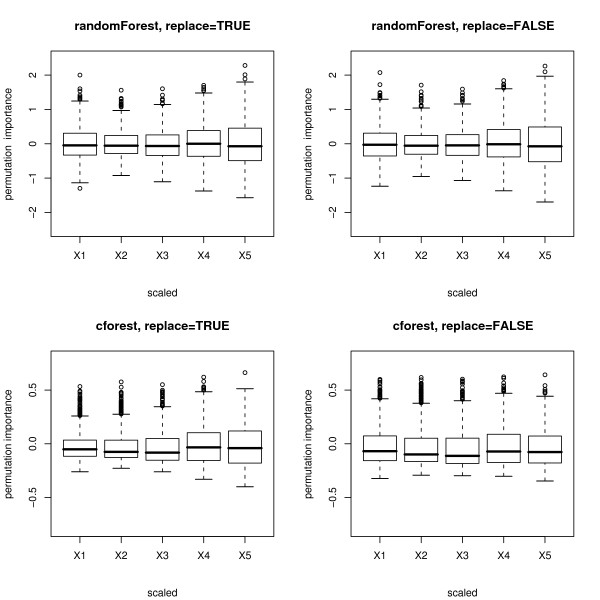
Conclusion: We propose to employ an alternative implementation of random forests, that provides unbiased variable selection in the individual classification trees. When this method is applied using subsampling without replacement, the resulting variable importance measures can be used reliably for variable selection even in situations where the potential predictor variables vary in their scale of measurement or their number of categories. The usage of both random forest algorithms and their variable importance measures in the R system for statistical computing is illustrated and documented thoroughly in an application re-analyzing data from a study on RNA editing. Therefore the suggested method can be applied straightforwardly by scientists in bioinformatics research.


Figures

Figure 1
Figure 1
Results of the null case study – variable selection frequency. Mean variable selection frequencies for the null case, where none of the predictor variables is informative. The plots in the top row display the frequencies when the randomForest function is used, the bottom row when the cforest function is used. The left column corresponds to bootstrap sampling with replacement, the right column to subsampling without replacement.
Figure 2
Figure 2
Results of the null case study – Gini importance. Mean Gini importance for the null case, where none of the predictor variables is informative. The left plot corresponds to bootstrap sampling with replacement, the right plot to subsampling without replacement.
Figure 3
Figure 3
Results of the null case study – unscaled permutation importance. Distributions of the unscaled permutation importance measures for the null case, where none of the predictor variables is informative. The plots in the top row display the distributions when the randomForest function is used, the bottom row when the cforest function is used. The left column corresponds to bootstrap sampling with replacement, the right column to subsampling without replacement.
Figure 4
Figure 4
Results of the null case study – scaled permutation importance. Distributions of the scaled permutation importance measures for the null case, where none of the predictor variables is informative. The plots in the top row display the distributions when the randomForest function is used, the bottom row when the cforest function is used. The left column corresponds to bootstrap sampling with replacement, the right column to subsampling without replacement.
Figure 5
Figure 5
Results of the power case study – variable selection frequency. Mean variable selection frequencies for the power case, where only the second predictor variable is informative. The plots in the top row display the frequencies when the randomForest function is used, the bottom row when the cforest function is used. The left column corresponds to bootstrap sampling with replacement, the right column to subsampling without replacement.
Figure 6
Figure 6
Results of the power case study – Gini importance. Mean Gini importance for the power case, where only the second predictor variable is informative. The left plot corresponds to bootstrap sampling with replacement, the right plot to subsampling without replacement.
Figure 7
Figure 7
Results of the power case study – unscaled permutation importance. Distributions of the unscaled permutation importance measures for the power case, where only the second predictor variable is informative. The plots in the top row display the distributions when the randomForest function is used, the bottom row when the cforest function is used. The left column corresponds to bootstrap sampling with replacement, the right column to subsampling without replacement.
Figure 8
Figure 8
Results of the power case study – scaled permutation importance. Distributions of the scaled permutation importance measures for the power case, where only the second predictor variable is informative. The plots in the top row display the distributions when the randomForest function is used, the bottom row when the cforest function is used. The left column corresponds to bootstrap sampling with replacement, the right column to subsampling without replacement.
Figure 9
Figure 9
Results for the C-to-U conversion data – scaled permutation importance. Scaled variable importance measures for the C-to-U conversion data. The plots in the top row display the measures when the randomForest function is used, the bottom row when the cforest function is used. The left column corresponds to bootstrap sampling with replacement, the right column to subsampling without replacement. In each plot the positions -20 through 20 indicate the nucleotides flanking the site of interest, and the last three bars on the right refer to the codon position (cp), the estimated folding energy (fe) and the difference in estimated folding energy (dfe).
Figure 10
Figure 10
Variable selection bias in individual trees. Relative selection frequencies for the rpart (left) and the ctree (right) classification tree methods. All variables are uninformative as in the null case simulation study.
Figure 11
Figure 11
Effects induced by bootstrapping. Distribution of the p values of χ2 tests of each categorical variable X2,..., X5 and the binary response for the null case simulation study, where none of the predictor variables is informative. The left plots correspond to the distribution of the p values computed from the original sample before bootstrapping. The right plots correspond to the distribution of the p values computed for each variable from the bootstrap sample drawn with replacement.

References

    1. Bureau A, Dupuis J, Falls K, Lunetta KL, Hayward B, Keith TP, Eerdewegh PV. Identifying SNPs Predictive of Phenotype Using Random Forests. Genetic Epidemiology. 2005;28:171–182. doi: 10.1002/gepi.20041. - DOI - PubMed
    1. Heidema AG, Boer JMA, Nagelkerke N, Mariman ECM, van der A DL, Feskens EJM. The Challenge for Genetic Epidemiologists: How to Analyze Large Numbers of SNPs in Relation to Complex Diseases. BMC Genetics. 2006;7:23. doi: 10.1186/1471-2156-7-23. - DOI - PMC - PubMed
    1. Breiman L. Random Forests. Machine Learning. 2001;45:5–32. doi: 10.1023/A:1010933404324. - DOI
    1. Díaz-Uriarte R, Alvarez de Andrés S. Gene Selection and Classification of Microarray Data Using Random Forest. BMC Bioinformatics. 2006;7:3. doi: 10.1186/1471-2105-7-3. - DOI - PMC - PubMed
    1. Lunetta KL, Hayward LB, Segal J, Eerdewegh PV. Screening Large-Scale Association Study Data: Exploiting Interactions Using Random Forests. BMC Genetics. 2004;5:32. doi: 10.1186/1471-2156-5-32. - DOI - PMC - PubMed

Publication types