Review
. 2007;40(9):1887-902.
doi: 10.1016/j.jbiomech.2006.09.003. Epub 2007 Jan 24.

Biomechanics of abdominal aortic aneurysm

Affiliations
Review

Biomechanics of abdominal aortic aneurysm

David A Vorp. J Biomech. 2007.

Abstract

Abdominal aortic aneurysm (AAA) is a condition whereby the terminal aorta permanently dilates to dangerous proportions, risking rupture. The biomechanics of AAA has been studied with great interest since aneurysm rupture is a mechanical failure of the degenerated aortic wall and is a significant cause of death in developed countries. In this review article, the importance of considering the biomechanics of AAA is discussed, and then the history and the state-of-the-art of this field is reviewed--including investigations into the biomechanical behavior of AAA tissues, modeling AAA wall stress and factors which influence it, and the potential clinical utility of these estimates in predicting AAA rupture.


Figures
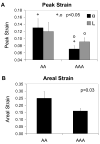
Figure 1
Figure 1
Peak strain and aerial strain for the equibiaxial tension protocol for AA and AAA tissue. From Vande Geest et al. (2004c)
Figure 2
Figure 2
The strain energy of the averaged isotropic relation from equation (1) (Raghavan and Vorp, 2000) and the averaged anisotropic constitutive relation for AAA (equations (2) and (3) and Table 2) versus equibiaxial strain (E). From Vande Geest et al. (2004c)
Figure 3
Figure 3
Typical set of stress-stretch curves for ILT samples taken from the luminal region (upper set of curves) and the medial region (lower set of curves). All data were obtained from the same ILT (same patient). From Wang et al. (2001)
Figure 4
Figure 4
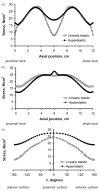
Comparison of stresses computed for a 3D asymmetric AAA model using the hyperelastic constitutive model given by equation (1) (Raghavan and Vorp, 2000) with those using a linearized elasticity model along anterior surface (A), along posterior surface (B), and around mid-section (C). Note the substantial error involved with using the theory of linearized elasticity. From Vorp et al. (1998)
Figure 5
Figure 5
Surface curvature analysis of a representative AAA. Shown are the mean (A) and Gaussian (B) curvature distributions. The mean curvature is equal to the inverse of mean radius of curvature of the surface. The Gaussian curvature indicates local surface shape. Adapted from Sacks et al. (1999).
Figure 6
Figure 6
Effect of asymmetry parameter β (bottom axis) and maximum diameter (top axis) on magnitude of peak stress within a patient-specific AAA. Both increasing diameter and increasing asymmetry (decreasing b) cause a nonlinear increase in peak stress. From Vorp et al. (1998).
Figure 7
Figure 7
Wall stress distributions for two AAA (top) and one nonaneurysmal aorta (bottom). Two views are shown for each aorta. The left view is the posterior surface, the right view is the anterior surface. Images are not to scale. The maximum diameter of the AAA at top, left is 5.5 cm, while that at top, right is 6.4 cm. All subjects had normal blood pressure. Note that, despite one AAA being smaller in diameter than the other, the peak wall stress is essentially equal, underscoring the need for a patient-specific technique to evaluate AAA. Adapted from Raghavan et al. (2000).
Figure 8
Figure 8
Comparison of 3D wall stress distribution between AAA models with and without ILT. Individual color scales (right) indicate von Mises stress for each AAA. Both posterior and anterior views are shown for each case. From Wang et al. (2002).
Figure 9
Figure 9
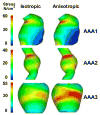
Maximum principal stresses for finite element simulations utilizing isotropic (equation (1)) and anisotropic (equations (2) and (3)) constitutive relations. From Vande Geest (2005).
Figure 10
Figure 10
Difference in tensile strength of ruptured and electively repaired AAA wall specimens. From DiMartino et al. (2006).
Figure 11
Figure 11
Predicted versus measured strength for one statistical model of wall strength. The solid line represents the line of unity. From Vande Geest et al. (2006a).
Figure 12
Figure 12
Demonstrative application of the statistical model of wall strength for four representative AAAs. Both posterior (left) and anterior (right) aspects are shown for each AAA. From Vande Geest et al. (2006a).

References

    1. Adolph R, Vorp DA, Steed DL, Webster MW, Kameneva MV, Watkins SC. Cellular content and permeability of intraluminal thrombus in abdominal aortic aneurysm. Journal of Vascular Surgery. 1997;25:916–26. - PubMed
    1. Asbury CL, Ruberti JW, Bluth EI, Peattie RA. Experimental investigation of steady flow in rigid models of abdominal aortic aneurysms. Annals of Biomedical Engineering. 1995;23:29–39. - PubMed
    1. Ashton HA, Buxton MJ, Day NE, Kim LG, Marteau TM, Scott RA, Thompson SG, Walker NM Multicentre Aneurysm Screening Study G. The multicentre aneurysm screening study (mass) into the effect of abdominal aortic aneurysm screening on mortality in men: A randomised controlled trial.[see comment] Lancet. 2002;360:1531–9. - PubMed
    1. Bengtsson H, Sonesson B, Bergqvist D. Incidence and prevalence of abdominal aortic aneurysms, estimated by necropsy studies and population screening by ultrasound. Proceedings, Volume 800 of the Annals of the New York Academy of Sciences; United States. 1996. - PubMed
    1. Blakemore AH, Voorhees AB., Jr The use of tubes constructed from vinyon N cloth in bridging arterial defects; experimental and clinical. Annals of Surgery. 1954;140:324–34. - PMC - PubMed

Publication types