Comparative Study
. 2007 Feb 22;4(12):155-66.
doi: 10.1098/rsif.2006.0161.

Comparative estimation of the reproduction number for pandemic influenza from daily case notification data

Affiliations
Comparative Study

Comparative estimation of the reproduction number for pandemic influenza from daily case notification data

Gerardo Chowell et al. J R Soc Interface. .

Abstract

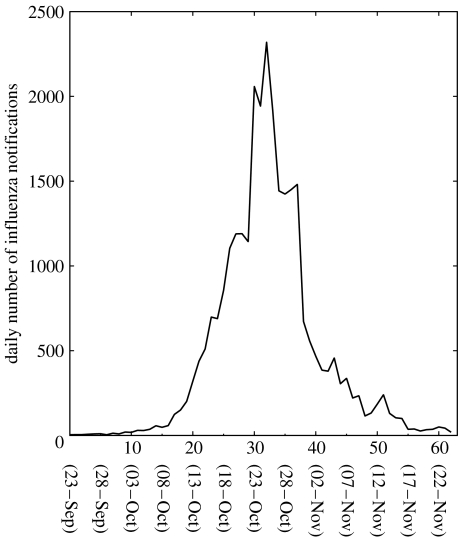
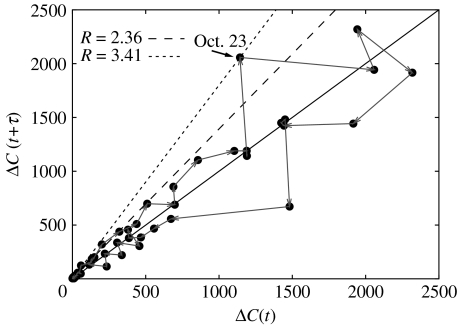
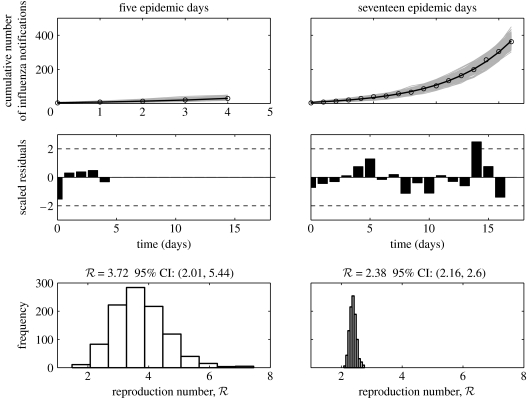
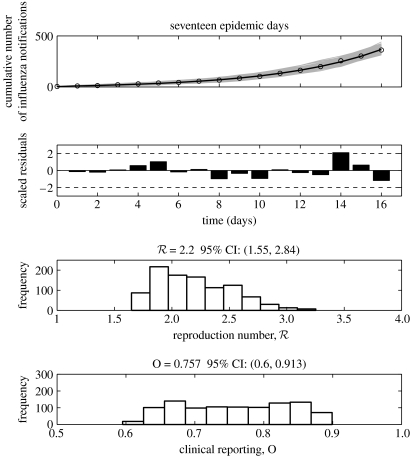
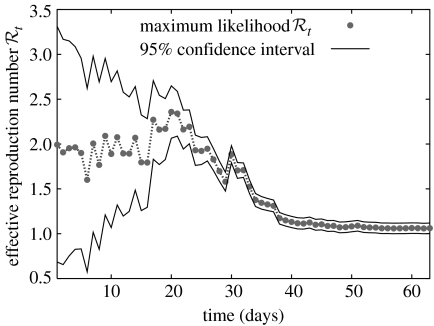
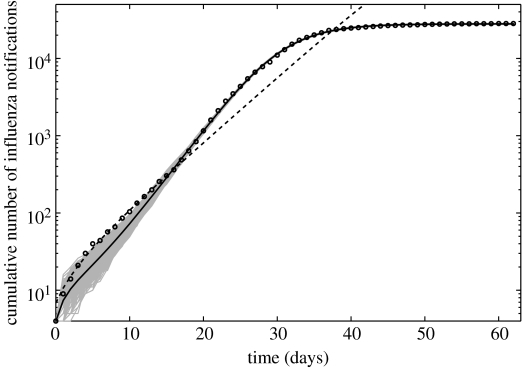
The reproduction number, R, defined as the average number of secondary cases generated by a primary case, is a crucial quantity for identifying the intensity of interventions required to control an epidemic. Current estimates of the reproduction number for seasonal influenza show wide variation and, in particular, uncertainty bounds for R for the pandemic strain from 1918 to 1919 have been obtained only in a few recent studies and are yet to be fully clarified. Here, we estimate R using daily case notifications during the autumn wave of the influenza pandemic (Spanish flu) in the city of San Francisco, California, from 1918 to 1919. In order to elucidate the effects from adopting different estimation approaches, four different methods are used: estimation of R using the early exponential-growth rate (Method 1), a simple susceptible-exposed-infectious-recovered (SEIR) model (Method 2), a more complex SEIR-type model that accounts for asymptomatic and hospitalized cases (Method 3), and a stochastic susceptible-infectious-removed (SIR) with Bayesian estimation (Method 4) that determines the effective reproduction number Rt at a given time t. The first three methods fit the initial exponential-growth phase of the epidemic, which was explicitly determined by the goodness-of-fit test. Moreover, Method 3 was also fitted to the whole epidemic curve. Whereas the values of R obtained using the first three methods based on the initial growth phase were estimated to be 2.98 (95% confidence interval (CI): 2.73, 3.25), 2.38 (2.16, 2.60) and 2.20 (1.55, 2.84), the third method with the entire epidemic curve yielded a value of 3.53 (3.45, 3.62). This larger value could be an overestimate since the goodness-of-fit to the initial exponential phase worsened when we fitted the model to the entire epidemic curve, and because the model is established as an autonomous system without time-varying assumptions. These estimates were shown to be robust to parameter uncertainties, but the theoretical exponential-growth approximation (Method 1) shows wide uncertainty. Method 4 provided a maximum-likelihood effective reproduction number 2.10 (1.21, 2.95) using the first 17 epidemic days, which is consistent with estimates obtained from the other methods and an estimate of 2.36 (2.07, 2.65) for the entire autumn wave. We conclude that the reproduction number for pandemic influenza (Spanish flu) at the city level can be robustly assessed to lie in the range of 2.0-3.0, in broad agreement with previous estimates using distinct data.


Figures

Figure 1
Figure 1
Daily number of influenza notifications in San Francisco, California during the 1918–1919 influenza pandemic (Department of Hygiene 1922).
Figure 2
Figure 2
The course of the outbreak can be visualized in an epidemic time-delay diagram of new cases ΔC at consecutive times (black dots). For data that are not too stochastic, this provides a very simple method to estimate R, via the tangent at the origin (dashed lines) of the initial growth trajectory (grey arrows). Jumps in case numbers (indicated for 22–23 Oct) lead to greater uncertainty in the estimation of the reproduction number.
Figure 3
Figure 3
The Χ2 density provided by three different models (Methods 1–3) to the initial epidemic growth phase of the cumulative number of influenza notifications as a function of the length of the initial epidemic phase. Using the goodness-of-fit statistic, the initial growth phase is predicted to be 5 days by Method 1 and 17 days by Methods 2 and 3.
Figure 4
Figure 4
Model fits, residuals plots and the resulting distributions of the reproduction number obtained after fitting the simple SEIR epidemic model (Method 2) to the initial phase of the autumn influenza wave using 5 and 17 epidemic days of the Spanish flu pandemic in San Francisco, California. In the top panel, the epidemic data of the cumulative number of reported influenza cases are the circles, the solid line is the model best-fit and the solid grey lines are 1000 realizations of the model fit to the data obtained through parametric bootstrapping as explained in the text.
Figure 5
Figure 5
Model fits, residuals plots and the resulting distributions of the reproduction number and the proportion of the clinical reporting obtained after fitting the complex SEIR epidemic model (Method 3) to the initial phase of the autumn influenza wave using 17 epidemic days of the Spanish flu pandemic in San Francisco, California. In the top panel, the epidemic data of the cumulative number of reported influenza cases are the circles, the solid line is the model best-fit and the solid grey lines are 1000 realizations of the model fit to the data obtained through parametric bootstrapping as explained in the text.
Figure 6
Figure 6
Sequential Bayesian estimation of the full distribution of Rt leads to the estimation of its maximum-likelihood value (grey dots) and 95% CIs (solid black lines). Uncertainty, measured by the width of the CI, decreases with more case observations. The estimates eventually lead to smaller Rt owing to depletion of susceptibles. At late times, Rt1 as a result of averaging periods in which the epidemic grows and declines.
Figure 7
Figure 7
The complex SEIR model fit (solid line) to the entire epidemic curve (circles) and the simple SEIR model fit (dashed line) calibrated using the initial exponential phase (17 days) are shown for comparison (cumulative cases are shown in logarithmic scale). Solid grey lines are 1000 realizations of the complex SEIR model fit to the data obtained through parametric bootstrapping as explained in the text.

References

    1. Anderson R.M, May R.M. Oxford University Press; Oxford, UK: 1991. Infectious diseases of humans.
    1. Antonovics J, Hood M.E, Howell Baker C. Molecular virology: was the 1918 flu avian in origin? Nature. 2006;440:E9. doi: 10.1038/nature04824. - DOI - PubMed
    1. Arino J, Brauer F, van den Driessche P, Watmough J, Wu J. Simple models for containment of a pandemic. J. R. Soc. Interface. 2006;3:453–457. doi: 10.1098/rsif.2006.0112. - DOI - PMC - PubMed
    1. Bettencourt, L. M. A. & Ribeiro, R. M. Submitted. Detecting early human transmission of H5N1 avian influenza. Proc. Natl Acad. Sci. USA.
    1. Breban R, Vardavas R, Blower S. Linking population-level models with growing networks: a class of epidemic models. Phys. Rev. E. 2005;72:046110. doi: 10.1103/PhysRevE.72.046110. - DOI - PubMed

Publication types

MeSH terms