. 2007 Mar 23;282(12):8837-47.
doi: 10.1074/jbc.M610369200. Epub 2007 Jan 25.

The function of guanylate cyclase 1 and guanylate cyclase 2 in rod and cone photoreceptors

Affiliations

The function of guanylate cyclase 1 and guanylate cyclase 2 in rod and cone photoreceptors

Wolfgang Baehr et al. J Biol Chem. .

Abstract

Retinal guanylate cyclases 1 and 2 (GC1 and GC2) are responsible for synthesis of cyclic GMP in rods and cones, but their individual contributions to phototransduction are unknown. We report here that the deletion of both GC1 and GC2 rendered rod and cone photoreceptors nonfunctional and unstable. In the rod outer segments of GC double knock-out mice, guanylate cyclase-activating proteins 1 and 2, and cyclic GMP phosphodiesterase were undetectable, although rhodopsin and transducin alpha-subunit were mostly unaffected. Outer segment membranes of GC1-/- and GC double knock-out cones were destabilized and devoid of cone transducin (alpha- and gamma-subunits), cone phosphodiesterase, and G protein-coupled receptor kinase 1, whereas cone pigments were present at reduced levels. Real time reverse transcription-PCR analyses demonstrated normal RNA transcript levels for the down-regulated proteins, indicating that down-regulation is posttranslational. We interpret these results to demonstrate an intrinsic requirement of GCs for stability and/or transport of a set of membrane-associated phototransduction proteins.


Figures
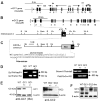
FIGURE 1
FIGURE 1. Mouse GC1 and GC2 gene structures, knock-out constructs, genotyping, and controls
The mouse GC1 (Gucy2e) (A) and the mouse GC2 (Gucy2f) (B) genes each consist of 19 exons (black boxes). Exons 2–4 encode the extracellular domain (ext), exon 5 encodes the transmembrane domain (tm), exons 6–12 encode the kinase homology domain (kin), exons 13 and 14 encode the dimerization or hinge domain (dd), and exons 15–19 encode the catalytic domain (cat). The knock-out construct of the mGC1 gene deletes 17 of 24 transmembrane residues (18). C, the knock-out construct of the mGC2 gene deletes a portion of exon 2 that includes ATG, the peptide leader sequence, and a portion of the mature N terminus of mGC2. D, PCR genotyping WT and knock-out GC1 gene (left) and genotyping the WT and knock-out GC2 gene (right). Diagnostic fragments for WT Gc1 (Gc1F4/G11R4) and knock-out Gc1 (NeoF4/Gc1R4) are 290 and 575 bp in size, respectively. Diagnostic fragments for WT GC2 (Gctowt1/Gctoda6) and knock-out GC2 (Pla2/Gc2mt-R2) are 1395 and 852 bp in size, respectively. E, immunoblots of retinal lysates probed with a polyclonal anti-GC1 antibody (left) and with a polyclonal anti-GC2 antibody (right). F, immunoblots of retinal lysates probed with polyclonal anti-GC1 and -GC2 antibodies. Anti-β-actin antibody was used as an internal control for loading.
FIGURE 2
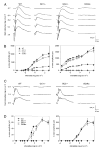
FIGURE 2. Full field ERGs of WT and GC deletion mutant mice under scotopic and photopic conditions
A, serial responses to increasing intensities of flash stimuli were obtained from dark-adapted WT, GC1−/−, GC2−/−, and GCdko mice. Although the GC1−/− response was severely attenuated, only double knock-out mice failed to produce any ERG responses. B, the a- and b-wave amplitudes, respectively, plotted as a function of light intensity under dark-adapted conditions. C, three representative serial responses to increasing intensities of flash stimuli were obtained from light-adapted WT, GC1−/−, GC2−/−, and GCdko mice. D, a- and b-wave amplitudes plotted as a function of light intensity under light-adapted conditions. 4 – 6 littermates of each genotype were used for analysis.
FIGURE 3
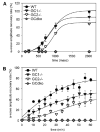
FIGURE 3. Measurements of a-wave recovery after a conditioning flash and after constant light stimulation
A, normalized recovery of a-wave amplitude as a function of interstimulus interval between the test and probe flashes. The dark-adapted mice were conditioned first with the test flash (0.4 log·cd·s·m−2) followed by a probe flash (1.6 log·cd·s·m−2) with interstimulus intervals ranging from 200 to 2,000 ms. Each trace represents the average recording from eight eyes. The interstimulus interval required to reach 50% a-wave amplitude recovery was not significantly different among genetic backgrounds (Table 1). As expected, GCdko photoreceptors were unresponsive. B, measurements of a-wave recovery following constant light stimulation. Dark-adapted mice were bleached with intense constant illumination (500 cd·s·m−2) for 3 min, and recovery of a-wave amplitude was monitored by recording single-flash ERGs (−0.2 log·cd·s·m−2) over the course of a 60-min dark adaptation period; the recovery ratio is plotted. The ratio in GC1−/−, GC2−/−, and GCdko mice was significantly attenuated compared with WT (GC1−/− and GC2−/− compared with WT, p < 0.001; GCdko compared with WT, p < 0.0001), and the ratio in GC2−/− was significantly attenuated relative to GC1−/− mice (GC1−/− to GC2−/−, p < 0.05).
FIGURE 4
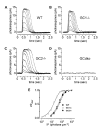
FIGURE 4. Suction pipette recordings from single rods of WT and GC1/2 knock-out mice
A–D, flash response families measured for a WT rod (A), a GC1−/− rod (B), a GC2−/− rod (C), and a GCdko rod (D). Each panel superimposes average responses to 10 – 60 flash stimuli with the flash strength increasing by a factor of 2 in A–C. The flash strengths were 8.4, 16.7, 33.3, 66.5, 123.4, 246.7, 485.1, and 970.2 photons μm−2 for both A and C; 2.3, 4.5, 8.4, 16.7, 33.3, 66.5, 123.4, 246.7 and 485.1 photons μm−2 for B; and 970.2 photons μm−2 for D. E, stimulus-response relationships for the cells shown in A–C. Peak response amplitudes normalized to saturating response amplitude are plotted against the flash strength. Data were fitted with saturating exponential functions that were used to estimate the strength of the flash producing a half-maximal response (WT, 45 photons μm−2; GC1−/−, 15 photons μm−2; GC2−/−, 55 photons μm−2). A flash of 500 nm with a duration of 10 ms was delivered at 300 ms.
FIGURE 5
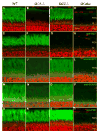
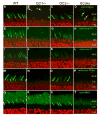
FIGURE 5. Confocal immunolocalization of GC1, GC2, GCAP1, GCAP2, and rod PDE6 in photoreceptors of WT and GC deletion mutant mice, aged 1–2 months
A–D, localization of GC1 (mAb IS4); E–H, localization of GC2 (pAb L670) in WT, GC1−/−, GC2−/−, and GCdko retina sections, respectively. GC1 (green) is absent in photoreceptors of GC1−/− retina, and GC2 is absent in GC2−/− retina, and both are absent in GCdko retina. Localizations of GCAP1 (pAb UW14) (I–L) and GCAP2 (pAb UW50) (M–P) are indicated by fluorescein isothio-cyanate-conjugated secondary antibody. Both GCAPs appear down-regulated in photoreceptors of GC1−/− and GCdko retina. Q–T, immunolocalization of rod PDE6 (green; MOE) in WT, GC1−/−, GC2−/−, and GCdko retina sections, respectively. Note that rod PDE6 is absent in GCdko retina. Sections were contrasted with propidium iodide to allow visualization of cell nuclei. IS, inner segments; ONL, outer nuclear layer. Magnification bars, 10 μm.
FIGURE 6
FIGURE 6. Immunolocalization of S-opsin, cone Tα, cone Tγ, cone PDE6α′, and GRK1 in retinas of WT and GC deletion mutants, aged 1–2 months
A–D, localization of S-opsin; E–H, cone Tα; I–L, cone Tγ, M–P, cone PDE6αQ–T, GRK1 in WT, GC1−/−, GC2−/−, and GCdko retinas, respectively. S-opsin, cone Tα, cone Tγ, cone PDE6α′, and GRK1 were localized normally to WT and GC2−/− COS. S-opsin mislocalizes to COS fragments in GC1−/− and GCdko retinas. Cone Tα, cone Tγ, and cone PDE6α′ appear down-regulated in GC1−/− and GCdko retinas. Anti-GRK1 labels cone outer segments prominently in the proximal OS layer, whereas the remainder is attributable to ROS. GRK1 is present in ROS of all four genotypes and in WT and GC2−/− COS but absent in GC1−/− and GCdko COS. Magnification bars, 10 μm.
FIGURE 7
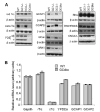
FIGURE 7. Immunoblots and transcript levels of down-regulated phototransduction components
A, immunoblots of WT, GC1−/−, GC2−/−, and GCdko retina lysates probed with anti-rod Tα, anti-cone Tα, anti-rod PDE6, anti-GCAP1, anti-GCAP2, anti-cone arrestin, and anti-GRK1 antibodies. Immunoblots of rhodopsin, PrBP/δ, and CNGA1, which are not down-regulated, are shown as controls. Internal controls with β-actin demonstrate loading levels. B, semiquantitative real time RT-PCR of different transcripts (rod Tα, cone Tα, rod PDE6α, GCAP1, and GCAP2). Duplicate samples were determined, each using two retinas of different animals, and run in parallel with Gapdh-specific primers as a standard. The relative mRNA expression level is defined as the fluorescence of each sample normalized to the fluorescence of Gapdh. Note that cone Tα levels are lower, since less than 10% of photoreceptors are cones.
FIGURE 8
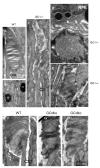
FIGURE 8. Ultrastructure of WT (A and B) and degenerative GC1−/− (C–E) cone outer segments
A, open arrows denote connecting cilia of cone photoreceptors for reference. The WT cone outer segment measures 1.3 μm at its widest point and tapers distally; B, cone inner segments were sometimes observed to contain electron-dense granules (stars). C, disorganized GC1−/− cone outer segment reveals apparent partitioning of membrane components; lamellar structures emanate from one side of the distal connecting cilium and vesicles from the tip. D, adjacent to the retinal pigmented epithelium (RPE), extracellular particle (2–3 μm in diameter) containing vesicles and tubules surrounded by membrane lamellae appears as an end product of membrane component sorting. Such a particle probably corresponds to the opsin-immunoreactive particles shown in Fig. 6B (see also Figs. S2B and S2J). E, another example of membrane partitioning is shown in which membrane layers are found to one side of the distal connecting cilium and vesicles/tubules extend from its tip. Cones were examined in a location inferior to the optic nerve for each genotype. F–H, electron micrographs of rod outer segments from WT and GCdko mouse retinas. The open arrow indicates the connecting cilium of the WT rod (F). Predegenerate ROS of GCdko retinas (G and H) have a striated appearance of alternating lamellae and tubules that may underlie the patchy patterns of rhodopsin kinase immunoreactivity observed in Fig. 6T and rod Tα immunoreactivity in Fig. S1H.

Similar articles

Cited by

References

    1. Lowe DG, Dizhoor AM, Liu K, Gu Q, Spencer M, Laura R, Lu L, Hurley JB. Proc Natl Acad Sci USA. 1995;92:5535–5539. - PMC - PubMed
    1. Garbers DL, Lowe DG. J Biol Chem. 1994;269:30741–30744. - PubMed
    1. Yang RB, Garbers DL. J Biol Chem. 1997;272:13738–13742. - PubMed
    1. Duda T, Koch KW. Mol Cell Biochem. 2002;230:107–116. - PubMed
    1. Seebacher T, Beitz E, Kumagami H, Wild K, Ruppersberg JP, Schultz JE. Hear Res. 1999;127:95–102. - PubMed

Publication types