. 2007 Apr 15;580(Pt. 2):649-58.
doi: 10.1113/jphysiol.2006.123075. Epub 2007 Jan 25.

Cutaneous afferents provide a neuronal population vector that encodes the orientation of human ankle movements

Affiliations

Cutaneous afferents provide a neuronal population vector that encodes the orientation of human ankle movements

Jean-Marc Aimonetti et al. J Physiol. .

Abstract

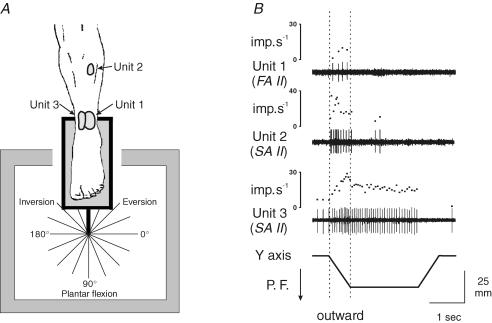
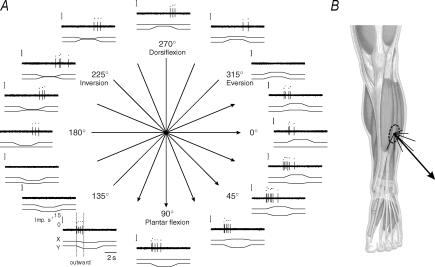
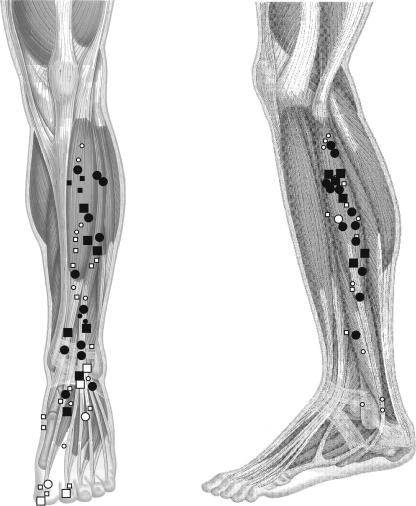
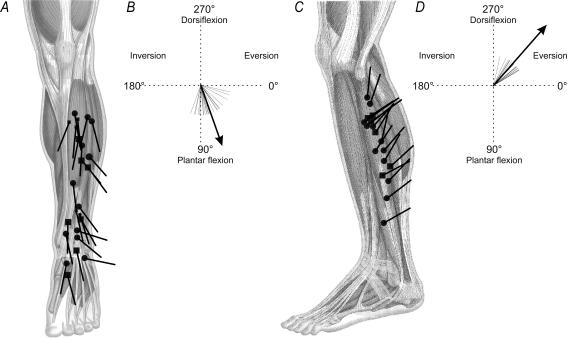
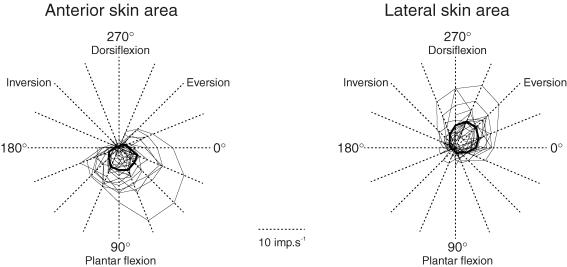
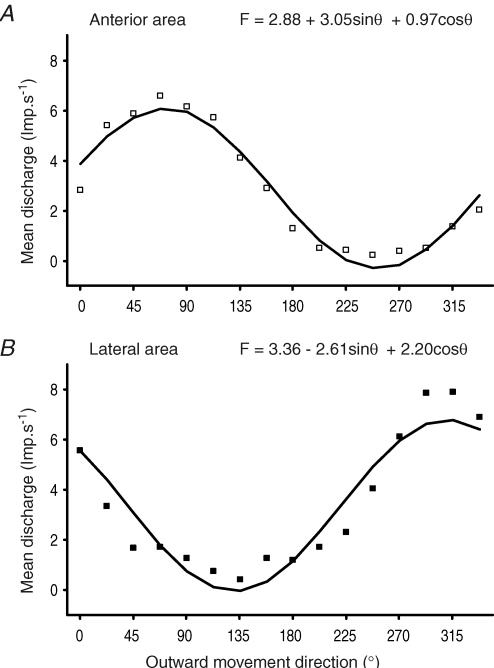
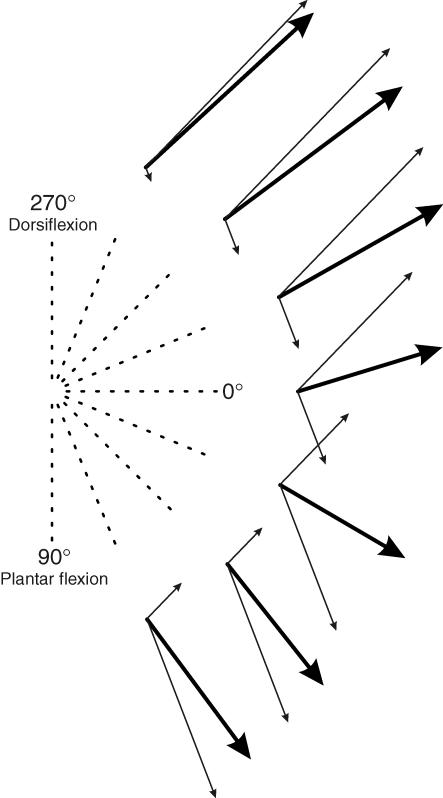
The aim of this study was to analyse the directional coding of two-dimensional limb movements by cutaneous afferents from skin areas covering a multidirectional joint, the ankle. The activity of 89 cutaneous afferents was recorded in the common peroneal nerve, and the mean discharge frequency of each unit was measured during the outward phase of ramp and hold movements imposed in 16 different directions. Forty-two afferents responded to the movements in the following decreasing order (SA2, n = 24/27; FA2, n = 13/17; FA1, n = 3/24; SA1, n = 2/21). All the units activated responded to a specific range of directions, defining their 'preferred sector', within which their response peaked in a given direction, their 'preferred direction'. Based on the distribution of the preferred directions, two populations of afferents, and hence two skin areas were defined: the anterior and the external lateral parts of the leg. As the directional tuning of each population was cosine shaped, the neuronal population vector model was applied and found to efficiently describe the movement direction encoded by cutaneous afferents, as it has been previously reported for muscle afferents. The responses of cutaneous afferents were then considered with respect to those of the afferents from the underlying muscles, which were previously investigated, and an almost perfect matching of directional sensitivity was observed. It is suggested that the common movement-encoding characteristics exhibited by cutaneous and muscle afferents, as early as the peripheral level, may facilitate the central co-processing of their feedbacks subserving kinaesthesia.


Figures

Figure 2
Figure 2. Typical patterns of cutaneous response to ramp-and-hold movements
A, location of the receptive fields of three cutaneous afferents tested in three subjects and diagram showing the 16 directions tested, where 270 deg corresponds to a dorsiflexion and 90 deg to a plantar flexion movement. B, response of these afferents during ramp-and-hold movements imposed in the direction of a plantar flexion (P.F.). The activity of each unit is illustrated by its spike train and the corresponding instantaneous frequency curve in response to movements along the vertical y axis. For further analysis, the mean discharge frequency was measured only during the outward movement (dotted vertical bars).
Figure 3
Figure 3. Responses of a SA II afferent to the 16 test directions
A, each diagram illustrates the response of a SA II unit to a given movement direction. From top to bottom, the diagram shows the instantaneous discharge frequency of the unit, its spike train, and the x and y coordinates of the movement. Arrows give the preferred sector of the unit. B, the receptive field of this unit was located on the belly of the extensor digitorum longus muscle. In each movement direction, the unit response is given by vectors (thin lines), the length of which corresponds to the mean discharge frequency. These vectors were then summed, giving a sum vector (bold line) indicating the preferred direction of the unit, i.e. 51.2 deg in the present case. For printing convenience, the modulus of the sum vector has been truncated.
Figure 1
Figure 1. Location of the centres of the afferent receptive fields and their responsiveness to movements
In the whole population of cutaneous afferents tested, the centres of the receptive fields were plotted on a standardized leg (left: anterior view; right: lateral view). The units were classified into slow- (circles) and fast- (squares) adapting mechanoreceptors. The receptive fields of type I units are given by small symbols and those of type II units are given by large symbols. Dark symbols correspond to units responsive to the imposed movements, and open symbols to non-responsive units.
Figure 4
Figure 4. The preferred directions of the cutaneous afferents responsive to movements
A and C, starting from the centre of its receptive field, the preferred direction of each cutaneous afferent is given by a line. For the meaning of symbols, see the legends to Fig. 1B and D, calculating the preferred direction in each skin area. Each cutaneous afferent has a preferred direction illustrated by a short, fine line. A population vector based on these individual vectors, gives the mean preferred direction (long, thick line) of the skin on the anterior part of the leg (B) and that on the external lateral part (D). Note that the data given in this figure involve only the angle of the preferred direction.
Figure 5
Figure 5. Individual and population preferred sectors
The response of each afferent to each movement direction was plotted on the axis of the corresponding movement. The points plotted were then connected by drawing thin lines forming a sector which corresponds to that afferent's preferred sector. Delimited by thick lines, the mean preferred sector of all afferents originating from the anterior skin area (left part) differs from that of the afferents from the lateral skin area (right part).
Figure 6
Figure 6. Population tuning curves
Each tuning curve gives the averaged response of each population of afferents responsive to movements to the 16 directions tested. Each population coded the various orientated movements according to a specific cosine-tuned function, the equation for which is given on top of each graph. Cosine-shaped curves mean that it is possible to apply the neuronal population vector model.
Figure 7
Figure 7. The neuronal population vector model
Each diagram gives the result obtained in one movement direction: the thin arrows give the population vector corresponding to each skin area and the thick arrow gives the sum vector calculated. As can be seen, the sum vectors calculated point approximately in the actual directions of the ongoing movements.

Similar articles

Cited by

References

    1. Albert F, Bergenheim M, Ribot-Ciscar E, Roll JP. The Ia afferent feedback of a given movement evokes the illusion of the same movement when returned to the subject via muscle tendon vibration. Exp Brain Res. 2006;172:163–174. - PubMed
    1. Batschelet E. Circular Statistics in Biology. London: Academic Press; 1981.
    1. Bergenheim M, Ribot-Ciscar E, Roll JP. Proprioceptive population coding of two-dimensional limb movements in humans. I. Muscle spindle feedback during spatially oriented movements. Exp Brain Res. 2000;134:301–310. - PubMed
    1. Bergenheim M, Roll JP, Ribot-Ciscar E. Microneurography in humans. In: Windhorst U, Johansson H, editors. Modern Techniques in Neuroscience Research. Berlin Heidelberg New York: Springer; 1999. pp. 801–819.
    1. Birznieks I, Jenmalm P, Goodwin AW, Johansson RS. Encoding of direction of fingertip forces by human tactile afferents. J Neurosci. 2001;21:8222–8237. - PMC - PubMed

Publication types