

Relative contributions of rod and cone bipolar cell inputs to AII amacrine cell light responses in the mouse retina
- PMID: 17255172
- PMCID: PMC2075551
- DOI: 10.1113/jphysiol.2006.120790
Relative contributions of rod and cone bipolar cell inputs to AII amacrine cell light responses in the mouse retina
Abstract
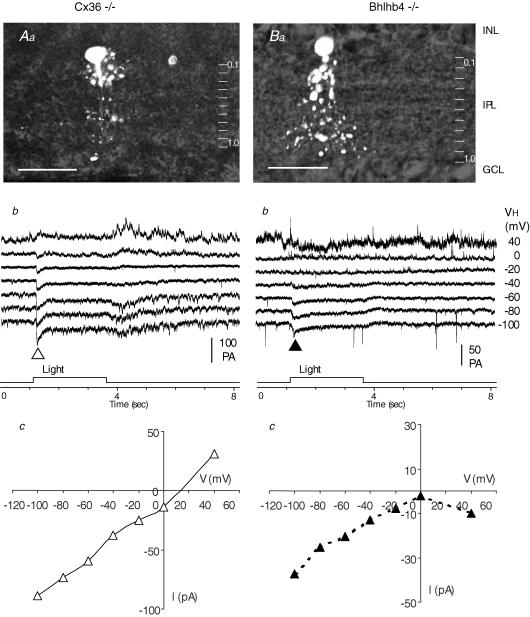
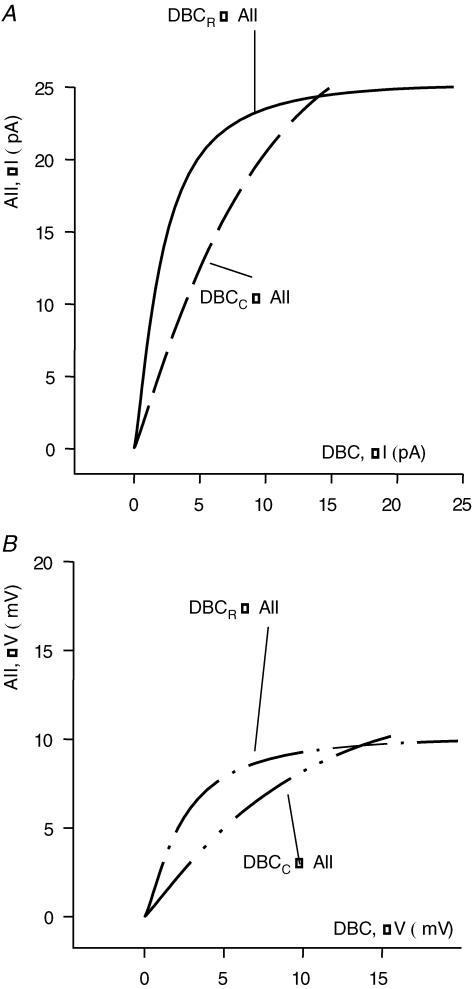
AII amacrine cells (AIIACs) are crucial relay stations for rod-mediated signals in the mammalian retina and they receive synaptic inputs from depolarizing and hyperpolarizing bipolar cells (DBCs and HBCs) as well as from other amacrine cells. Using whole-cell voltage-clamp technique in conjunction with pharmacological tools, we found that the light-evoked current response of AIIACs in the mouse retina is almost completely mediated by two DBC synaptic inputs: a 6,7-dinitro-quinoxaline-2,3-dione (DNQX)-resistant component mediated by cone DBCs (DBC(C)s) through an electrical synapse, and a DNQX-sensitive component mediated by rod DBCs (DBC(R)s). This scheme is supported by AIIAC current responses recorded from two knockout mice. The dynamic range of the AIIAC light response in the Bhlhb4-/- mouse (which lacks DBC(R)s) resembles that of the DNQX-resistant component, and that of the connexin36 (Cx36)-/- mouse resembles the DNQX-sensitive component. By comparing the light responses of the DBC(C)s with the DNQX-resistant AIIAC component, and light responses of the DBC(R)s with the DNQX-sensitive AIIAC component, we obtained the input-output relations of the DBC(C)-->AIIAC electrical synapse and the DBC(R)-->AIIAC chemical synapse. Similar to other glutamatergic chemical synapses in the retina, the DBC(R)-->AIIAC synapse is non-linear. Its highest voltage gain (approximately 5) is found near the dark membrane potential, and it saturates for presynaptic signals larger than 5.5 mV. The DBC(C)-->AIIAC electrical synapse is approximately linear (voltage gain of 0.92), consistent with the linear junctional conductance found in retinal electrical synapses. Moreover, relative DBC(R) and DBC(C) contributions to the AIIAC response at various light intensity levels are determined.
Figures


Similar articles
-
Light-evoked current responses in rod bipolar cells, cone depolarizing bipolar cells and AII amacrine cells in dark-adapted mouse retina.J Physiol. 2004 Aug 1;558(Pt 3):897-912. doi: 10.1113/jphysiol.2003.059543. Epub 2004 Jun 4. J Physiol. 2004. PMID: 15181169 Free PMC article.
-
Synaptic circuitry mediating light-evoked signals in dark-adapted mouse retina.Vision Res. 2004 Dec;44(28):3277-88. doi: 10.1016/j.visres.2004.07.045. Vision Res. 2004. PMID: 15535995
-
Direct rod input to cone BCs and direct cone input to rod BCs challenge the traditional view of mammalian BC circuitry.Proc Natl Acad Sci U S A. 2010 Jan 5;107(1):395-400. doi: 10.1073/pnas.0907178107. Epub 2009 Dec 14. Proc Natl Acad Sci U S A. 2010. PMID: 20018684 Free PMC article.
-
Electrical synapses between AII amacrine cells in the retina: Function and modulation.Brain Res. 2012 Dec 3;1487:160-72. doi: 10.1016/j.brainres.2012.05.060. Epub 2012 Jul 7. Brain Res. 2012. PMID: 22776293 Review.
-
Multiple neuronal connexins in the mammalian retina.Cell Commun Adhes. 2003 Jul-Dec;10(4-6):425-30. doi: 10.1080/cac.10.4-6.425.430. Cell Commun Adhes. 2003. PMID: 14681052 Review.
Cited by
-
Synaptic Vesicle Exocytosis at the Dendritic Lobules of an Inhibitory Interneuron in the Mammalian Retina.Neuron. 2015 Aug 5;87(3):563-75. doi: 10.1016/j.neuron.2015.07.016. Neuron. 2015. PMID: 26247863 Free PMC article.
-
Single transient intraocular pressure elevations cause prolonged retinal ganglion cell dysfunction and retinal capillary abnormalities in mice.Exp Eye Res. 2020 Dec;201:108296. doi: 10.1016/j.exer.2020.108296. Epub 2020 Oct 8. Exp Eye Res. 2020. PMID: 33039455 Free PMC article.
-
Rod, M-cone and M/S-cone inputs to hyperpolarizing bipolar cells in the mouse retina.J Physiol. 2012 Feb 15;590(4):845-54. doi: 10.1113/jphysiol.2011.224113. Epub 2012 Jan 4. J Physiol. 2012. PMID: 22219344 Free PMC article.
-
The oscillation-like activity in bullfrog ON-OFF retinal ganglion cell.Cogn Neurodyn. 2016 Dec;10(6):481-493. doi: 10.1007/s11571-016-9397-x. Epub 2016 Jul 20. Cogn Neurodyn. 2016. PMID: 27891197 Free PMC article.
-
Genetic dissection of rod and cone pathways mediating light responses and receptive fields of ganglion cells in the mouse retina.Vision Res. 2020 Feb;167:15-23. doi: 10.1016/j.visres.2019.12.005. Epub 2019 Dec 27. Vision Res. 2020. PMID: 31887538 Free PMC article.
References
Publication types
MeSH terms
Substances
Grants and funding
LinkOut - more resources
Full Text Sources
Molecular Biology Databases