. 2007 May 15;109(10):4328-35.
doi: 10.1182/blood-2006-12-064170. Epub 2007 Jan 25.

TCRzetadim lymphocytes define populations of circulating effector cells that migrate to inflamed tissues

Affiliations

TCRzetadim lymphocytes define populations of circulating effector cells that migrate to inflamed tissues

Zhuoli Zhang et al. Blood. .

Abstract

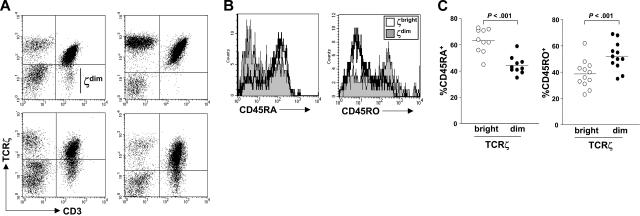
The T-cell receptor zeta (TCRzeta) chain is a master sensor and regulator of lymphocyte responses. Loss of TCRzeta expression has been documented in infectious, inflammatory, and malignant diseases, suggesting that it may serve to limit T-cell reactivity and effector responses at sites of tissue damage. These observations prompted us to explore the relationship between TCRzeta expression and effector function in T cells. We report here that TCRzeta(dim) lymphocytes are enriched for antigen-experienced cells refractory to TCR-induced proliferation. Compared to their TCRzeta(bright) counterparts, TCRzeta(dim) cells share characteristics of differentiated effector T cells but use accessory pathways for transducing signals for inflammatory cytokine gene expression and cell contact-dependent pathways to activate monocytes. TCRzeta(dim) T cells accumulate in inflamed tissues in vivo and have intrinsic migratory activity in vitro. Whilst blocking leukocyte trafficking with anti-TNF therapy in vivo is associated with the accumulation of TCRzeta(dim) T cells in peripheral blood, this T-cell subset retains the capacity to migrate in vitro. Taken together, the functional properties of TCRzeta(dim) T cells make them promising cellular targets for the treatment of chronic inflammatory disease.


Figures

Figure 1
Figure 1
TCRζ expression in PBLs from healthy donors. (A) PBLs were analyzed for expression of TCRζ and CD3 by flow cytometry. Four donors illustrating the heterogeneity of TCRζ expression are shown. (B) PBLs were stained for TCRζ and CD3 expression. CD45RA and CD45RO expression on TCRζbright and TCRζdim subsets were then determined by flow cytometry. (C) The percent CD45RA+ or CD45RO+ cells residing within TCRζbright and TCRζdim subsets were analyzed for 10 or 12 healthy donors, respectively. Horizontal lines represent mean values.
Figure 2
Figure 2
The TCRζdim cell subset is enriched for antigen experienced T cells. (A) Healthy donor PBLs were stained with CFSE prior to stimulation with OKT3. At the indicated times, cells were harvested, stained for TCRζ together with CD3, CD4, or CD8, and dilution of CFSE fluorescence determined by flow cytometry. Proliferating TCRζbright cells are indicated (arrows). (B) Fresh PBLs from HLA-B*0702+ CMV-reactive donors were stimulated in vitro with p65 CMV peptide, IL-2, and IL-7. Eight days later, cells were stained for the presence of peptide-reactive CD8+ T cells using fluorescent HLA-B7/p65 MHC-peptide tetramers and anti-CD8. (C) Cells were stained for TCRζ expression and the percent CD8+ tetramer-positive T cells within TCRζbright and TCRζdim subsets determined. The percent tetramer-positive cells is indicated. Data are representative of multiple experiments.
Figure 3
Figure 3
TCRζdim cells are enriched for cytokine-producing effector T cells. Fresh PBLs were stimulated with PMA and ionomycin for 6 hours prior to staining for CD3, TCRζ, and intracellular expression of (A) TNF-α, (B) IFN-γ, and (C) IL-10. Data are expressed as percent cytokine-expressing cells within TCRζbright or TCRζdim subsets for 12 healthy donors. Horizontal lines represent mean values.
Figure 4
Figure 4
Antigen-independent effector function of TCRζdim T cells. (A) TCRζdim T cells were generated from purified T cells following stimulation for 7 days with IL-2, IL-6, and TNF-α in the absence of antigen or antigen-presenting cells. TCRζ expression is shown compared to that of unstimulated T cells. (B) TCRζdim T cells were cocultured with CHO cells expressing empty vector, CD80, or CD86 for 24 hours. Supernatants were harvested and IFN-γ and IL-10 levels determined by ELISA. (C) Resting (TCRζbright) or activated TCRζdim T cells were fixed prior to coculture at the indicated ratios with purified monocytes. Supernatants were harvested 24 hours later and TNF-α levels determined by ELISA. Supernatants derived from cultures of monocytes or T cells alone or LPS-stimulated monocytes were used as negative and positive controls, respectively. Data are representative of multiple experiments, and represent mean cytokine levels ± SD in panels B and C.
Figure 5
Figure 5
TCRζdim T cells are enriched at sites of inflammation and accumulate in PB after treatment with anti-TNF in a subset of patients. (A) A dot plot of TCRζ versus CD3ϵ expression in PB and SF T cells from a patient with RA, as determined by flow cytometry. (B) Paired PB and SF mononuclear cells from patients with active inflammatory synovitis were stained for TCRζ and analyzed by flow cytometry. Mononuclear cell suspensions were prepared from synovial tissue (ST) specimens obtained from patients with RA at joint arthroplasty. Data are expressed as percent CD3+TCRζdim T cells in each compartment. (C) The percent CD3+TCRζdim cells was determined by flow cytometry in PBLs from 17 patients with RA at baseline and 14 weeks after treatment with anti-TNF. Data were stratified according to EULAR clinical response criteria (poor, moderate, or good), defined at 30 weeks.
Figure 6
Figure 6
TCRζdim T cells exhibit enhanced migratory capacity in vitro. (A) Healthy donor PBLs (5 × 10⁶) were applied to the gelatin-coated Transwell containing a monolayer of TNF-α–stimulated HUVECs and cells in upper and lower chambers harvested at 24 hours prior to staining for expression of CD3ϵ and TCRζ and analysis by flow cytometry. Representative dot plots are shown. (B) Subset analysis of migrating cells. After 24 hours cells were harvested and stained for TCRζ and CD3, CD4, or CD8, as in panel A. Data are expressed as the percentage of cells migrating relative to the total number of each cell subset added to the Transwell. The significance of differences between migration of TCRζbright and TCRζdim cells is shown. (C) The chemokines CXCL10, CCL5, or CXCL12 were added to each lower chamber of the Transwell at 50 ng/mL and the total number of PBLs migrating determined after 24 hours; *P < .013; **P = .063; ***P < .004 compared to cells migrating in the absence of exogenous chemokine. (D) The effects of each chemokine on the migration of TCRζbright and TCRζdim cells were determined by flow cytometry, as described. Differences in migration between subsets was highly significant (P < .002), with the exception of migration in response to CXCL12. Within subset differences between “medium” and CXCL12-stimulated cells were also significant (P < .023).
Figure 7
Figure 7
PB CD4+TCRζdim T cells retain the capacity to migrate in vitro despite anti-TNF treatment in vivo. PBLs acquired from patients with RA at baseline and 14 weeks after treatment with anti-TNF were analyzed for their capacity to migrate in vitro using the transendothelial migration assay. Migrating cell subsets were determined by flow cytometry. Data are expressed as percent cells migrating for (A) PBLs and CD3+TCRζdim T cells, (B) CD4+TCRζdim and CD8+TCRζdim T cells, and (C) the CD3TCRζ+ NK and the nonlymphocyte CD3TCRζ cell subsets; *P = .066; **P < .047.

References

    1. Germain RN, Stefanova I. The dynamics of T cell receptor signaling: complex orchestration and the key roles of tempo and cooperation. Annu Rev Immunol. 1999;17:467–522. - PubMed
    1. Klausner RD, Lippincott-Schwartz J, Bonifacino JS. The T cell antigen receptor: insights into organelle biology. Annu Rev Cell Biol. 1990;6:403–431. - PubMed
    1. Cosson P, Lankford SP, Bonifacino JS, Klausner RD. Membrane protein association by potential intramembrane charge pairs. Nature. 1991;351:414–416. - PubMed
    1. Irving BA, Weiss A. The cytoplasmic domain of the T cell receptor zeta chain is sufficient to couple to receptor-associated signal transduction pathways. Cell. 1991;64:891–901. - PubMed
    1. Letourneur F, Klausner RD. Activation of T cells by a tyrosine kinase activation domain in the cytoplasmic tail of CD3 epsilon. Science. 1992;255:79–82. - PubMed

Publication types

MeSH terms

Substances