Emergent dynamics of thymocyte development and lineage determination
- PMID: 17257050
- PMCID: PMC1782042
- DOI: 10.1371/journal.pcbi.0030013
Emergent dynamics of thymocyte development and lineage determination
Abstract
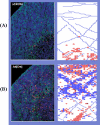
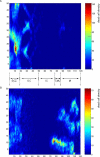
Experiments have generated a plethora of data about the genes, molecules, and cells involved in thymocyte development. Here, we use a computer-driven simulation that uses data about thymocyte development to generate an integrated dynamic representation-a novel technology we have termed reactive animation (RA). RA reveals emergent properties in complex dynamic biological systems. We apply RA to thymocyte development by reproducing and extending the effects of known gene knockouts: CXCR4 and CCR9. RA simulation revealed a previously unidentified role of thymocyte competition for major histocompatability complex presentation. We now report that such competition is required for normal anatomical compartmentalization, can influence the rate of thymocyte velocities within chemokine gradients, and can account for the disproportion between single-positive CD4 and CD8 lineages developing from double-positive precursors.
Conflict of interest statement
Figures


Similar articles
-
Aberrant T-cell ontogeny and defective thymocyte and colonic T-cell chemotactic migration in colitis-prone Galphai2-deficient mice.Immunology. 2007 Oct;122(2):199-209. doi: 10.1111/j.1365-2567.2007.02629.x. Epub 2007 May 9. Immunology. 2007. PMID: 17490434 Free PMC article.
-
Impaired chemokine-induced migration during T-cell development in the absence of Jak 3.Immunology. 2004 Jun;112(2):191-200. doi: 10.1111/j.1365-2567.2004.01863.x. Immunology. 2004. PMID: 15147562 Free PMC article.
-
Complex regulation of CCR9 at multiple discrete stages of T cell development.Eur J Immunol. 2006 Jan;36(1):73-81. doi: 10.1002/eji.200535203. Eur J Immunol. 2006. PMID: 16342233
-
Reactive animation: from piecemeal experimentation to reactive biological systems.Autoimmunity. 2011 Jun;44(4):271-81. doi: 10.3109/08916934.2010.523260. Epub 2011 Jan 19. Autoimmunity. 2011. PMID: 21244340 Review.
-
Molecular mechanisms governing thymocyte migration: combined role of chemokines and extracellular matrix.J Leukoc Biol. 2004 Jun;75(6):951-61. doi: 10.1189/jlb.1003455. Epub 2004 Mar 12. J Leukoc Biol. 2004. PMID: 15020651 Review.
Cited by
-
Four-dimensional realistic modeling of pancreatic organogenesis.Proc Natl Acad Sci U S A. 2008 Dec 23;105(51):20374-9. doi: 10.1073/pnas.0808725105. Epub 2008 Dec 17. Proc Natl Acad Sci U S A. 2008. PMID: 19091945 Free PMC article.
-
Systems biology in immunology: a computational modeling perspective.Annu Rev Immunol. 2011;29:527-85. doi: 10.1146/annurev-immunol-030409-101317. Annu Rev Immunol. 2011. PMID: 21219182 Free PMC article. Review.
-
Ergodic sets as cell phenotype of budding yeast cell cycle.PLoS One. 2012;7(10):e45780. doi: 10.1371/journal.pone.0045780. Epub 2012 Oct 1. PLoS One. 2012. PMID: 23049686 Free PMC article.
-
Agent-based modeling of host-pathogen systems: The successes and challenges.Inf Sci (N Y). 2009 Apr 29;179(10):1379-1389. doi: 10.1016/j.ins.2008.11.012. Inf Sci (N Y). 2009. PMID: 20161146 Free PMC article.
-
State-transition diagrams for biologists.PLoS One. 2012;7(7):e41165. doi: 10.1371/journal.pone.0041165. Epub 2012 Jul 23. PLoS One. 2012. PMID: 22844438 Free PMC article.
References
-
- Anderson G, Jenkinson EJ. Lymphostromal interactions in thymic development and function. Nat Rev Immunol. 2001;1:31–40. - PubMed
-
- Petrie HT. Cell migration and the control of post-natal T-cell lymphopoiesis in the thymus. Nat Rev Immunol. 2003;3:859–866. - PubMed
-
- Janeway C. Immunobiology: The immune system in health and disease. New York: Garland Science; 2001. 600
-
- Takahama Y. Journey through the thymus: Stromal guides for T-cell development and selection. Nat Rev Immunol. 2006;6:127–135. - PubMed
Publication types
MeSH terms
Substances
LinkOut - more resources
Full Text Sources
Research Materials

