. 2007 Jan 26;3(1):e17.
doi: 10.1371/journal.pgen.0030017.

Gene Duplication of the zebrafish kit ligand and partitioning of melanocyte development functions to kit ligand a

Affiliations

Gene Duplication of the zebrafish kit ligand and partitioning of melanocyte development functions to kit ligand a

Keith A Hultman et al. PLoS Genet. .

Abstract

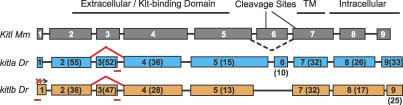
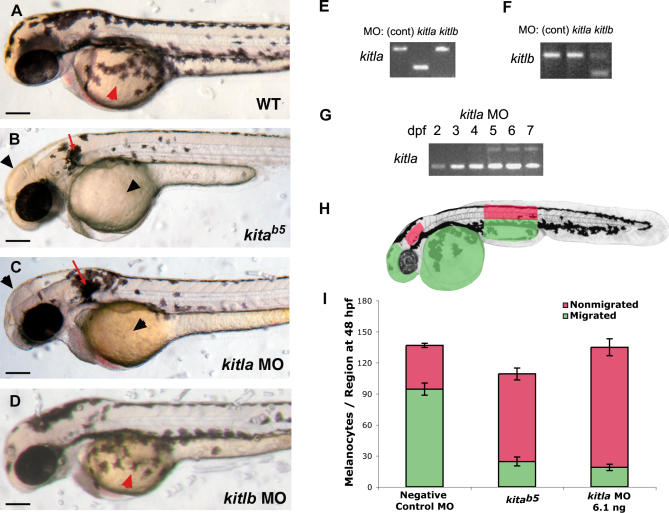
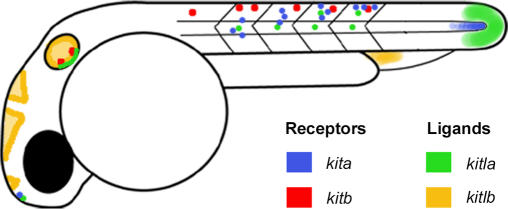
The retention of particular genes after the whole genome duplication in zebrafish has given insights into how genes may evolve through partitioning of ancestral functions. We examine the partitioning of expression patterns and functions of two zebrafish kit ligands, kit ligand a (kitla) and kit ligand b (kitlb), and discuss their possible coevolution with the duplicated zebrafish kit receptors (kita and kitb). In situ hybridizations show that kitla mRNA is expressed in the trunk adjacent to the notochord in the middle of each somite during stages of melanocyte migration and later expressed in the skin, when the receptor is required for melanocyte survival. kitla is also expressed in other regions complementary to kita receptor expression, including the pineal gland, tail bud, and ear. In contrast, kitlb mRNA is expressed in brain ventricles, ear, and cardinal vein plexus, in regions generally not complementary to either zebrafish kit receptor ortholog. However, like kitla, kitlb is expressed in the skin during stages consistent with melanocyte survival. Thus, it appears that kita and kitla have maintained congruent expression patterns, while kitb and kitlb have evolved divergent expression patterns. We demonstrate the interaction of kita and kitla by morpholino knockdown analysis. kitla morphants, but not kitlb morphants, phenocopy the null allele of kita, with defects for both melanocyte migration and survival. Furthermore, kitla morpholino, but not kitlb morpholino, interacts genetically with a sensitized allele of kita, confirming that kitla is the functional ligand to kita. Last, we examine kitla overexpression in embryos, which results in hyperpigmentation caused by an increase in the number and size of melanocytes. This hyperpigmentation is dependent on kita function. We conclude that following genome duplication, kita and kitla have maintained their receptor-ligand relationship, coevolved complementary expression patterns, and that functional analysis reveals that most or all of the kita receptor's function in the embryo are promoted by its interaction with kitla.


Conflict of interest statement

Competing interests. The authors have declared that no competing interests exist.

Figures

Figure 1
Figure 1. Phylogenetic Tree of kitl Protein Sequences
The topology of the tree suggests that the kitl locus duplicated before the teleost radiation. Dr, Danio rerio (zebrafish), Fr, Fugu rubripes (fugu), Ga, Gasterosteus aculeatus (stickleback), Ol, Oryzias latipes (medaka), Am, Ambystoma mexicanum (axolotl), Gg, Gallus gallus (chick), Xl, Xenopus laevis (Xenopus), Mm, Mus Musculus (mouse), Hs, Homo sapiens (human). Bootstrap values from 1,000 replicates are labeled.
Figure 2
Figure 2. Genomic Structure Alignment with Mouse Kitl
Exons (boxes) are drawn to scale and are labeled according to their homology with mouse sequence. Pairwise similarity (percent identical residues plus conserved amino acid substitutions based on the Blossum40 matrix) of the zebrafish protein to the mouse protein is presented for each exon in parentheses. Full-length values for mouse to zebrafish kitla: 29% identical and 43% similar. Full-length values for mouse to zebrafish kitlb: 20% identical and 50% similar. Although quite diverged in sequence, the zebrafish paralogs display well-conserved intron site locations with themselves and with the mouse ortholog. The best alignment of kitlb reveals that it has lost exon 6, which is alternatively spliced in mouse and human. Exon 5 of kitla has expanded 3′ with a corresponding contraction of exon 6. Kit binding domain contains the residues that interact with Kit as determined from crystal structures of the two mouse proteins [26,27]. The locations of the major cleavage site in mouse exon 6 and the minor cleavage site in mouse exon 7 are indicated. We cannot identify either cleavage site by sequence conservation in either zebrafish gene (see also Dataset S1). MOs (red bars) were targeted to overlap the ATG start site for kitlb and the exon 3–intron 3 boundary of kitla and kitlb. The splice site MOs resulted in splicing of exon 2 to exon 4 (red lines), resulting in a shorter, in-frame, transcript (see Figure 4E and 4F).
Figure 4
Figure 4. kitla Morphant Phenocopies kitab5 Migration
(A) Wild-type embryonic pigment pattern at 2 dpf shows melanocytes migrating over the yolk (red arrowhead). (B) kitab5 mutants show migration phenotype, with melanocytes remaining near ear (red arrow) and dorsum and absent on yolk and head (black arrowheads). (C) Wild-type embryos injected with kitla MOs (6.1 ng) exhibit migratory phenotype similar to kitab5 with melanocytes present near the ear (red arrow) and absent at the head and yolk (black arrowheads). (D) Wild-type embryos injected with kitlb MOs (6.0 ng) are indistinguishable from wild-type showing melanocytes present over the yolk (red arrowhead) by 2 dpf. (E–G) RT-PCR of morphant embryos shows MO specificity: (E) kitla RT-PCR of wild-type, kitla MO, and kitlb MO at 3 dpf; (F) kitlb RT-PCR of wild-type, kitla MO, and kitlb MO at 3 dpf; and (G) kitla RT-PCR of kitla MO at 2, 3, 4, 5, 6, and 7 dpf, revealing that aberrant splice product caused by the MO is dominant until 5 dpf, when wild-type message is visible. (H) Regions in embryo that were used to define migrated and nonmigrated melanocytes for quantitative analysis of melanocyte migration. Red areas indicate nonmigrated melanocytes in the dorsal and lateral stripe above the hind yolk and behind the ear. Green areas define migrated melanocytes on the head, on the yolk, and in the ventral and yolk sac stripe of the hind yolk. Note that melanocytes that have migrated to positions between the dorsum and the horizontal myoseptum, a region with typically no melanocytes, would be scored as nonmigrated in the embryo, while any melanocyte that migrates past the horizontal myoseptum would be scored as migrated, whether its migration is appropriate or not. (I) Quantitative analysis for melanocyte migration of negative control MOs (6.8 ng), kitab5, and kitla MO (6.1 ng). kitla MO embryos display a similar loss of migration as kitab5. Mean values with 95% confidence interval are reported, n = 10. Scale bars: 150 μm.
Figure 3
Figure 3. kitla and kitlb Whole Mount In Situ Hybridizations
(A–F) kitla mRNA expression during stages of migration. (A) kitla expression is first seen at 19 hpf in the presomitic mesoderm of the tail bud (black arrowhead). (B) Section of 19-hpf tail bud. (C) High magnification shows expression of kitla mRNA in the pineal gland at 26 hpf. (D) High magnification shows kitla mRNA in the ear at 26 hpf in the sensory epithelium, with pronounced staining in the ventral otic vesicle (black arrowhead). (E) kitla mRNA is expressed in groups of cells at the horizontal myoseptum in the middle of each somite (black arrowheads) in the trunk beginning at 22 hpf through 30 hpf (image is 26 hpf). We also observe kitla-positive cells in more dorsal locations in the posterior somites (red arrowheads). (F) Cross section of trunk shows expression near notochord at 26 hpf. (G and H) kitlb mRNA expression during stages of migration. kitlb is expressed in the ventricles of the brain (black arrowheads), in the ear (red arrow), and in the cardinal vein plexus (red arrowhead) at 24 hpf (G). Cross section of brain ventricle shows kitlb expressed in cells lining the brain ventricles (H). (I and J) kitla and kitlb mRNA expression at 4 dpf, during stage of kita-dependent survival. kitla mRNA is expressed throughout the skin (black arrowhead) and in the dorsal myotome (red arrowhead) (I). kitlb mRNA is expressed faintly in the skin (black arrowhead) (J). Scale bars: (A) 100 μm, (B) 25 μm, (C) 100 μm, (D) 50 μm, (E) 100 μm, (F) 25 μm, (G) 100 μm, (H) 10 μm, (I) 25 μm, and (J) 25 μm. nt, neural tube; nc, notochord; pm, presomitic mesoderm
Figure 5
Figure 5. kitla Morphant Phenocopies kitab5 Survival Phenotype
(A) Wild-type larva at 8 dpf. (B) Higher magnification of dorsal melanocyte stripe of 8 dpf wild-type larva with healthy melanocytes (black arrowhead). (C) kitla MO shows fewer melanocytes at 8 dpf, similar to kitab5. (D) Higher magnification of kitla MO showing melanocytes blebbing through the skin (red arrow), characteristic of melanocyte programmed cell death. (E and F) kitlb MO at 8 dpf (E) and higher magnification (F) of kitlb MO 8 dpf, which is indistinguishable from wild-type. (G) Total melanocyte counts show that the survival phenotypes of kitab5 and kitla MO are similar. Scale bars: 100 μm.
Figure 6
Figure 6. kitla MO Enhances Temperature-Sensitive kitj1e99 Allele
(A) kitj1e99 embryos reared at 28 °C appear similar to wild-type melanocyte pattern (see Figure 4A for wild-type) at 3 dpf. (B) A submaximal dose (0.5 to 0.8 ng) of kitla MOs shows little effect in wild-type embryos. (C) Submaximal dose of kitla MOs shows a significant migration phenotype in kitj1e99. (D and E) Quantitative analysis of kitj1e99kitla enhancement. Melanocytes were counted at 3 dpf and scored as migrated if in green regions or nonmigrated if in regions shown in red (Figure 4H). Mean values with 95% confidence interval are reported (n = 10). (D) Using this metric, wild-type embryos average 94.4 (69% of total) migrating melanocytes. A submaximal dose of kitla MOs results in 16.4 fewer migrated melanocytes than wild-type. kitj1e99 embryos reared at 28 °C have 3.7 fewer migrated melanocytes. Neither the number of total melanocytes or of migrating melanocytes in kitj1e99 nor the submaximal dose of kitla MOs is significantly different compared with wild-type. (E) Migration effect is defined as the difference in migrating melaocytes compared to wild-type. If the combined effects of  kitj1e99 and the submaximal dose of kitla MOs are additive, we expect a migration effect of −20.1 in the kitj1e99kitla MO larvae (−16.4 ± 3.7). Instead, we observe a migration effect of −40.7. The χ2 test between the number of migrated melanocytes in the kitj1e99kitla MO larvae and the expected number reveals this difference to be significantly (p < 0.0002) greater than additive. Scale bars: 150 μm.
Figure 7
Figure 7. kitla Overexpression Causes Hyperpigmentation in Wild-type but Not in kitab5 Embryos
(A) Wild-type larva. (B) Larva injected with kitla::JRed fusion construct shows hyperpigmentation with melanocytes covering a larger area than wild-type. (C) kita larva. (D) kitla::JRed injected into kitb5 embryos results in kitb5 phenotype. (E) kitla::JRed hyperpigmented larvae have more melanocytes on the dorsal stripe than do wild-type. When kitla expression vector is injected into kita embryos, there is no change in the number of melanocytes. All larvae at 6 dpf (n = 10). Scale bars: 150 μm.
Figure 8
Figure 8. Stylized Drawing of Zebrafish Embryo Displaying mRNA Expression Patterns of kita and kitb Receptor Tyrosine Kinases and Their Candidate Ligands, kitla and kitlb
Coincident expression is noted for kita (blue) and kitla (green) in the trunk, tail bud, ear, and pineal gland. kitb (red) and kitlb (yellow) do not appear coincident. kitlb does not appear to have a coincident receptor for its expression in brain ventricles or in cardinal vein plexus. kitb may be coincident with kitla expression in the trunk.

References

    1. Little CC. The inheritance of black-eyed white spotting in mice. Am Nat. 1915;49:727–740.
    1. Geissler EN, Ryan MA, Housman DE. The dominant-white spotting (W) locus of the mouse encodes the c-kit proto-oncogene. Cell. 1988;55:185–192. - PubMed
    1. Qiu FH, Ray P, Brown K, Barker PE, Jhanwar S, et al. Primary structure of c-kit: Relationship with the CSF-1/PDGF receptor kinase family: Oncogenic activation of v-kit involves deletion of extracellular domain and C terminus. EMBO J. 1988;7:1003–1011. - PMC - PubMed
    1. Orr-Urtreger A, Avivi A, Zimmer Y, Givol D, Yarden Y, et al. Developmental expression of c-kit, a proto-oncogene encoded by the W locus. Development. 1990;109:911–923. - PubMed
    1. Sarvella PA, Russell LB. Steel, a new dominant gene in the house mouse. J Hered. 1956;47:123–128.

Publication types