. 2007 Jan;3(1):e11.
doi: 10.1371/journal.ppat.0030011.

Inhibition of NF-kappaB activation in vivo impairs establishment of gammaherpesvirus latency

Affiliations

Inhibition of NF-kappaB activation in vivo impairs establishment of gammaherpesvirus latency

Laurie T Krug et al. PLoS Pathog. 2007 Jan.

Abstract

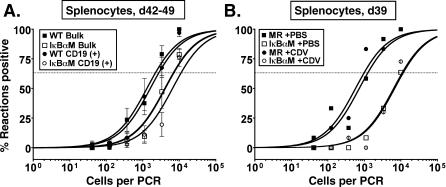
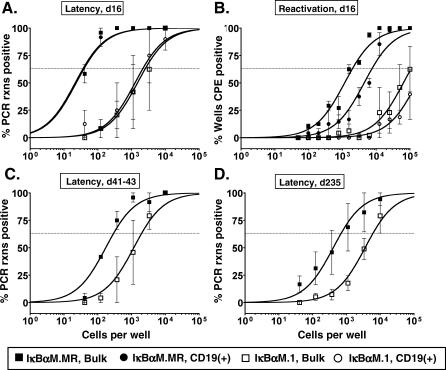
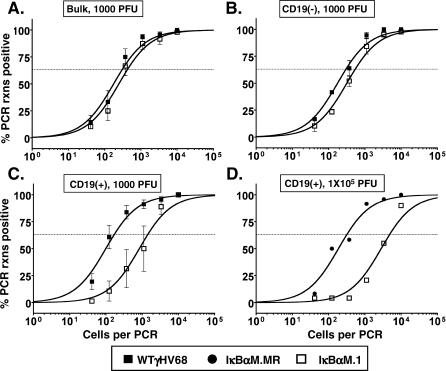
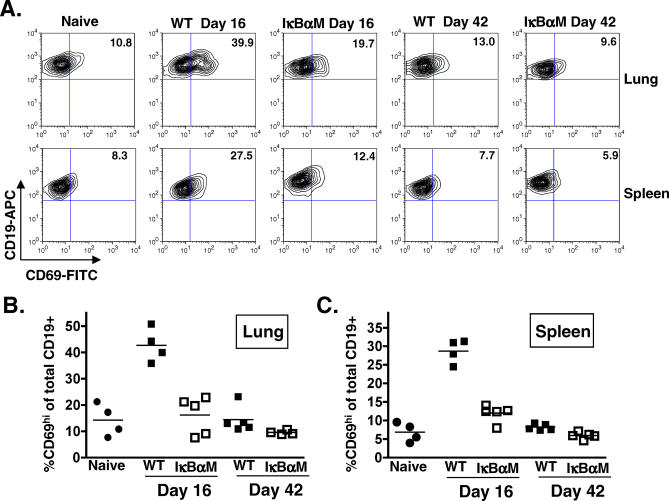
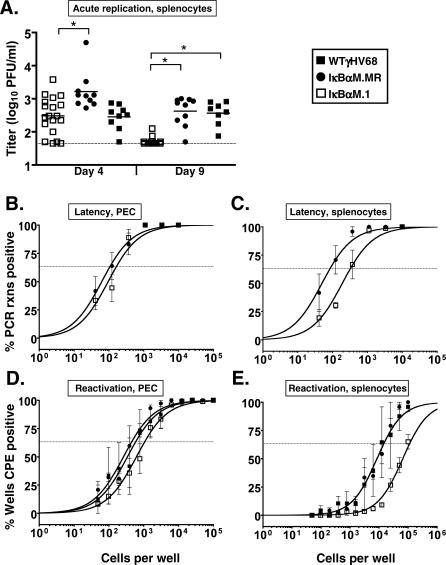
A critical determinant in chronic gammaherpesvirus infections is the ability of these viruses to establish latency in a lymphocyte reservoir. The nuclear factor (NF)-kappaB family of transcription factors represent key players in B-cell biology and are targeted by gammaherpesviruses to promote host cell survival, proliferation, and transformation. However, the role of NF-kappaB signaling in the establishment of latency in vivo has not been addressed. Here we report the generation and in vivo characterization of a recombinant murine gammaherpesvirus 68 (gammaHV68) that expresses a constitutively active form of the NF-kappaB inhibitor, IkappaBalphaM. Inhibition of NF-kappaB signaling upon infection with gammaHV68-IkappaBalphaM did not affect lytic replication in cell culture or in the lung following intranasal inoculation. However, there was a substantial decrease in the frequency of latently infected lymphocytes in the lung (90% reduction) and spleens (97% reduction) 16 d post intranasal inoculation. Importantly, the defect in establishment of latency in lung B cells could not be overcome by increasing the dose of virus 100-fold. The observed decrease in establishment of viral latency correlated with a loss of activated, CD69(hi) B cells in both the lungs and spleen at day 16 postinfection, which was not apparent by 6 wk postinfection. Constitutive expression of Bcl-2 in B cells did not rescue the defect in the establishment of latency observed with gammaHV68-IkappaBalphaM, indicating that NF-kappaB-mediated functions apart from Bcl-2-mediated B-cell survival are critical for the efficient establishment of gammaherpesvirus latency in vivo. In contrast to the results obtained following intranasal inoculation, infection of mice with gammaHV68-IkappaBalphaM by the intraperitoneal route had only a modest impact on splenic latency, suggesting that route of inoculation may alter requirements for establishment of virus latency in B cells. Finally, analyses of the pathogenesis of gammaHV68-IkappaBalphaM provides evidence that NF-kappaB signaling plays an important role during multiple stages of gammaHV68 infection in vivo and, as such, represents a key host regulatory pathway that is likely manipulated by the virus to establish latency in B cells.


Conflict of interest statement

Competing interests. The authors have declared that no competing interests exist.

Figures

Figure 1
Figure 1. Construction and Verification of the γHV68-IκBαM Viruses
(A) Genomic structure of WT γHV68, γHV68-IκBαM.1 and γHV68-IκBαM.2, and γHV68-IκBαM.MR in the ORF27-29b intergenic region. In γHV68-IκBαM.1 and .2 viruses, the 1.8-kb HCMV immediate-early promoter-driven IκBαM expression cassette was inserted at the PmlI site in either the rightward or leftward orientation, respectively. All genome coordinates are based on the γHV68 WUMS sequence. Bars below the genomic regions indicate regions used as probes in the Southern blot. B, BamHI; H, HindIII; P, PmlI. (B) Southern blot analysis of WT γHV68, γHV68-IκBαM.1 and γHV68-IκBαM.2, and γHV68-IκBαM.MR viral genomes. Viral DNA was purified from extracellular virions and subsequently digested with BamHI or HindIII, electrophoresed, blotted, and hybridized with a 32P-labeled probe as indicated. The fragment sizes of 32P-labeled BstEII-digested Lambda DNA are indicated.
Figure 2
Figure 2. γHV68-IκBαM Inhibits NF-κB Signaling in Fibroblasts
(A) NIH 3T12 fibroblasts were infected with WT virus at an MOI of 1 or 10 for 6 h and then transfected with a NF-κB–responsive luciferase reporter construct and, where indicated, a plasmid expressing MEKK1. Data are shown as the mean fold activation of the NF-κB promoter over mock infected samples ±SD of triplicate wells. (B) NIH 3T12 cells were infected with the indicated viruses at an MOI of 10 for 6 h and then transfected with the NF-κB luciferase reporter construct and a plasmid expressing MEKK1. At 24 h posttransfection, wells were harvested and luciferase activity was quantitated. Data are shown as the mean fold activation of the NF-κB promoter over mock infected, MEKK1-transfected samples ±SD of triplicate wells and are representative of multiple independent experiments. IκBαM.R1 and IκBαM.R2 were viruses recovered from reactivating splenocytes harvested from mice infected with either the IκBαM.1 or IκBαM.2 recombinant virus, respectively. (C) Electrophoretic mobility shift analysis of NF-κB binding using nuclear extracts prepared from NIH 3T12 cells infected with the indicated viruses at an MOI of 3 for 48 h, as described in Materials and Methods. Also shown, as a positive control for NF-κB induction, is treatment of uninfected NIH 3T12 cells with 25 ng/ml TNFα for 1 h prior to harvest. Specific (arrow) and nonspecific (open circle) complexes are indicated.
Figure 3
Figure 3. Inhibition of NF-κB Signaling Does Not Impair Lytic Replication In Vitro or Acute Replication in the Lungs
(A) Single-step growth curve in MEFs, with an MOI of 5.0 PFU per cell with the indicated virus. Samples were harvested at the indicated time points and titers were determined on NIH 3T12 fibroblasts as described in Materials and Methods. (B) Multistep growth curve in MEFs, with an MOI of 0.05 PFU per cell with the indicated viruses. (C) Multistep growth curve in NIH 3T12 cells, with an MOI of 0.05 PFU per cell with the indicated viruses. Data are representative of at least two independent experiments. (D and E) C57Bl6 mice were infected with 1,000 PFU by the intranasal route of inoculation with the indicated viruses. On the indicated days postinfection, lungs (D) and spleens (E) were harvested, disrupted, and titered on NIH 3T12 cells. The data were compiled from one or two experiments with three to five mice analyzed per experiment. Data are shown as log10 titer, and the bar indicates the geometric mean titer. The dashed line indicates the limit of detection of this assay as log101.7 or 50 PFU/ml of sample homogenate.
Figure 4
Figure 4. Splenic Latency Is Markedly Reduced in Mice Infected with 1,000 PFU of γHV68-IκBαM by the Intranasal Route of Inoculation
Bulk splenocytes or flow cytometry-sorted CD19+ splenic cell populations were harvested from infected C57BL/6 mice at 15 or 16 dpi and analyzed by limiting-dilution viral genome PCR (A and C) and limiting-dilution ex vivo reactivation assays (B and D) as described in Materials and Methods. (A) Frequency of unsorted, bulk splenocytes harboring viral genomes. (B) Frequency of unsorted, bulk splenocytes reactivating virus. Significant levels of preformed virus were not detected. (C) Frequency of sorted CD19+ B cells harboring viral genome. Using a PE-conjugated antibody to the pan–B-cell marker CD19 (CD19-PE), splenic B cells were separated into B-cell (CD19+) and non–B-cell (CD19) populations isolated by FACS. Postsort FACS analysis indicated that the mean purities for CD19+ cells were 97.7 ± 1.1% for WT and 96.7 ± 3.4% for IκBαM.1. (D) Frequency of sorted CD19+ B cells reactivating virus. For both limiting-dilution assays, curve fit lines were derived from nonlinear regression analysis, and symbols represent the mean percentage of wells positive for virus (viral DNA or cytopathic effect) ±SEM. The dashed line represents 63.2%, from which the frequency of viral genome–positive cells or the frequency of cells reactivating virus was calculated based on Poisson distribution. The data shown represent three to five independent experiments with spleen cells pooled from five mice per experimental group. Where examined, the frequency of splenocytes and CD19+ B cells that harbored viral genome in mice infected with IκBαM.1 or IκBαM.2 was significantly different (p < 0.02) from that of mice infected with WT or IκBαM.MR control viruses.
Figure 5
Figure 5. γHV68-IκBαM–Infected Mice Have Decreased Splenic Latency at Later Timepoints after Intranasal Infection that Is Not Altered by Inhibiting Lytic Replication
Bulk splenocytes or FACS-sorted CD19+ splenic cell populations were harvested from infected C57BL/6 mice and analyzed by limiting-dilution viral genome PCR. (A) Frequency of unsorted, bulk and CD19+ B cells from mice infected with 1,000 PFU of WT γHV68 or IκBαM.1 harboring viral genomes at 42 and 49 dpi. Postsort FACS analysis indicated that the mean purities for CD19+ cells were 97.8 ± 1.3% for WT and 98.5 ± 1.5% for IκBαM.1. Data represent three independent experiments with spleen cells pooled from five mice per experimental group. The frequency of splenocytes and CD19+ B cells that harbored viral genome in mice infected with IκBαM was significantly different from that of mice infected with WT virus in an unpaired t-test as follows: p = 0.0146 (unsorted splenocytes) and p = 0.0198 (CD19+). (B) The effect of treatment with the antiviral drug cidofovir between 16 and 39 dpi on the frequency of viral genome–positive cells in mice infected with IκBαM.MR or IκBαM.1. Mice were injected subcutaneously with 100 μl of PBS or with 25 mg/kg cidofovir (CDV) in 100 μl of PBS every 3 d between 16 and 39 dpi. Mice were weighed weekly, and dosage was adjusted. Data represent one (PBS) or two (CDV) independent experiments of three to six mice per experimental group. The frequency of splenocytes that harbored viral genome in the mice infected with IκBαM.1 was significantly different (p = 0.0351) from that of mice infected with IκBαM.MR. Symbols represent the mean percentage of wells positive for virus (viral DNA) ±SEM.
Figure 6
Figure 6. Transgenic Expression of Bcl-2 in B Cells Does Not Rescue the Defect in Splenic Latency Establishment by γHV68-IκBαM after Intranasal Infection
Bulk unsorted splenocytes or magnetic bead–enriched CD19+ splenocytes from infected C57BL/6-Tg(BCL2) were analyzed by limiting-dilution viral genome PCR (A, C, and D) and limiting-dilution ex vivo reactivation assays (B) as described in Materials and Methods. (A) Frequency of unsorted, bulk splenocytes and CD19+ B cells from mice infected with 1,000 PFU of IκBαM.MR or IκBαM.1 harboring viral genomes at 16 dpi. Using a PE-conjugated antibody to the pan–B-cell marker CD19 (CD19-PE), splenic B cells were separated into B-cell (CD19+) and non–B-cell (CD19) populations by magnetic activated cell sorting. Postsort FACS analysis indicated that the mean purities for CD19+ cells were 97.4 for WT, and 96.5 ± 1.5% for IκBαM.1. The frequency of splenocytes that harbored viral genome in mice infected with IκBαM was significantly different (p = 0.05) from that of mice infected with IκBαM.MR virus. (B) Frequency of unsorted, bulk splenocytes and CD19+ B cells reactivating virus from mice infected with 1,000 PFU of IκBαM.MR or IκBαM.1 at 16 dpi. The frequency of splenocytes and CD19+ B cells that harbored viral genome in mice infected with IκBαM was significantly different from that of mice infected with IκBαM.MR in a t-test as follows: p = 0.0460 (unsorted splenocytes) and p = 0.0286 (CD19+). (C) Frequency of unsorted, bulk splenocytes reactivating virus from mice infected with 1,000 PFU of IκBαM.MR or IκBαM.1 at 41 to 43 dpi. CD19+ B cells comprise greater than 67% of total splenocytes as determined by FACS analysis. (D) Frequency of unsorted, bulk splenocytes reactivating virus from mice infected with 1,000 PFU of IκBαM.MR or IκBαM.1 at 235 dpi. FACS analysis indicated that the unsorted splenocytes were composed of 66.3 ± 2.0% (IκBαM.MR) and 60.3 ± 7.7% (IκBαM.1) CD19+ B cells. Symbols represent the mean percentage of wells positive for virus (viral DNA or cytopathic effect) ±SEM. The data shown represent two independent experiments with cells pooled from three to five mice per experimental group (16 and 41 to 43 dpi) or one experiment with four individual mice at 235 dpi.
Figure 7
Figure 7. IκBαM.1-Infected Mice Have Decreased Latency in Lung B Cells 16 dpi after Intranasal Infection
Bulk lung cells, or lung cell subsets, were harvested from infected C57BL/6 mice at 16 dpi and analyzed by limiting-dilution viral genome PCR as described in Materials and Methods. (A) Frequency of unsorted, bulk lung cells harboring viral genomes. (B) Frequency of CD19 non–B cells harboring viral genomes. Using a PE-conjugated antibody to the pan–B-cell marker CD19 (CD19-PE), splenic B cells were separated into B-cell (CD19+) and non–B-cell (CD19) populations by magnetic activated cell sorting. Postsort FACS analysis indicated that the mean purities for CD19 cells were 97.2 ± 2.4% for WT γHV68 and 98.7 ± 0.9% for IκBαM.1. (C) Frequency of subsets enriched for CD19+ B cells harboring viral genome. Subsequent to magnetic separation, postsort FACS analysis indicated that the mean purities for CD19+ cells were 82.3 ± 0.5% for WT γHV68 and 82.0 ± 1.3% for IκBαM.1. Given that in presort FACs analysis CD19+ cells comprised approximately 9% of the lung cell suspension, magnetic separation generated a 9-fold enrichment of CD19+ B cells. The data shown represent three independent experiments with spleen cells pooled from 12 to 15 mice per experimental group. The frequency of splenocytes and CD19+ B cells that harbored viral genome in mice infected with IκBαM was significantly different (p = 0.0316) from that of mice infected with WT viruses. (D) Frequency of FACS sorted CD19+ B cells harboring viral genomes in the lungs of mice infected with 1 × 10⁵ PFU of IκBαM.MR or IκBαM.1. Postsort FACS analysis indicated that the purity of the CD19+ cell population was 86% for IκBαM.MR and 93% for IκBαM.1. The data shown represent a single experiment with 15 mice per group. Curve fit lines were derived from nonlinear regression analysis, and symbols represent the mean percentage of wells positive for virus (viral DNA) ±SEM.
Figure 8
Figure 8. Activated B Cells Are Decreased in the Lungs and Spleens of IκBαM-Infected Mice
Cells were prepared from the lungs and spleens harvested from four uninfected naïve mice or from four or five mice that were infected 16 and 42 d prior to harvest with 1,000 PFU of WT γHV68 or IκBαM.1. Cells from individual mice were surface stained with anti-CD19 conjugated to allophycocyanin and anti-CD69 conjugated to FITC and analyzed by flow cytometry. (A) Flow cytometric dotplots of stained cells from the lungs (upper panel) and spleens (lower panel). Values shown in the upper right quadrant of each dotplot are the percentages of CD19+ cells that express the CD69 activation marker in a representative experimental sample. (B) Each point in the scatterplot represents the percentage of CD19+CD69hi cells from the lung of a single mouse; the bar represents the mean percentage. The percentage of CD19+CD69hi cells in the lungs of mice infected with IκBαM.1 was significantly different from that of mice infected with WT γHV68; p = 0.0007 at 16 dpi. (C) Each point in the scatterplot represents the percentage of CD19+CD69hi cells from the spleen of a single mouse; the bar represents the mean percentage. The percentage of CD19+CD69hi cells in the spleens of mice infected with IκBαM.1 was significantly different from that of mice infected with WT γHV68; p < 0.0001 at 16 dpi and p = 0.0042 at 42 dpi.
Figure 9
Figure 9. Route- and Tissue-Dependent Requirement for NF-κB
C57Bl6 mice were infected with 1,000 PFU by the intraperitoneal route of inoculation with the indicated viruses. (A) On 4 and 9 dpi, spleens were harvested, disrupted, and titered on NIH 3T12 cells. The data are compiled from two (IκBαM.MR and WT) or four (IκBαM.1) experiments with four or five mice per group. Asterisks denote that the acute splenic titers for IκBαM.1 differed significantly from IκBαM.MR on day 4 (p = 0.0036) and from IκBαM.MR (p < 0.0001) and WT (p < 0.0001) on day 9, as determined by the Mann-Whitney nonparametric test. (B) Frequency of PECs harboring viral genomes. (C) Frequency of unsorted, bulk splenocytes harboring viral genome. (D) Frequency of PECs reactivating virus. (E) Frequency of splenocytes reactivating virus. For both limiting-dilution assays, curve fit lines were derived from nonlinear regression analysis, and symbols represent the mean percentage of wells positive for virus (viral DNA or cytopathic effect) ±SEM. The data shown represent three to five independent experiments with cells pooled from five mice per experimental group.

References

    1. Souza TA, Stollar BD, Sullivan JL, Luzuriaga K, Thorley-Lawson DA. Peripheral B cells latently infected with Epstein-Barr virus display molecular hallmarks of classical antigen-selected memory B cells. Proc Natl Acad Sci U S A. 2005;102:18093–18098. - PMC - PubMed
    1. Willer DO, Speck SH. Long-term latent murine gammaherpesvirus 68 infection is preferentially found within the surface immunoglobulin D-negative subset of splenic B cells in vivo. J Virol. 2003;77:8310–8321. - PMC - PubMed
    1. Kim IJ, Flano E, Woodland DL, Lund FE, Randall TD, et al. Maintenance of long term gamma-herpesvirus B cell latency is dependent on CD40-mediated development of memory B cells. J Immunol. 2003;171:886–892. - PubMed
    1. Sunil-Chandra NP, Arno J, Fazakerley J, Nash AA. Lymphoproliferative disease in mice infected with murine gammaherpesvirus 68. Am J Pathol. 1994;145:818–826. - PMC - PubMed
    1. Tarakanova VL, Suarez F, Tibbetts SA, Jacoby MA, Weck KE, et al. Murine gammaherpesvirus 68 infection is associated with lymphoproliferative disease and lymphoma in BALB beta2 microglobulin-deficient mice. J Virol. 2005;79:14668–14679. - PMC - PubMed

Publication types

MeSH terms

Associated data