. 2007 Mar 23;367(2):558-73.
doi: 10.1016/j.jmb.2006.12.066. Epub 2006 Dec 29.

Dimer dissociation and unfolding mechanism of coagulation factor XI apple 4 domain: spectroscopic and mutational analysis

Affiliations

Dimer dissociation and unfolding mechanism of coagulation factor XI apple 4 domain: spectroscopic and mutational analysis

Paul W Riley et al. J Mol Biol. .

Abstract

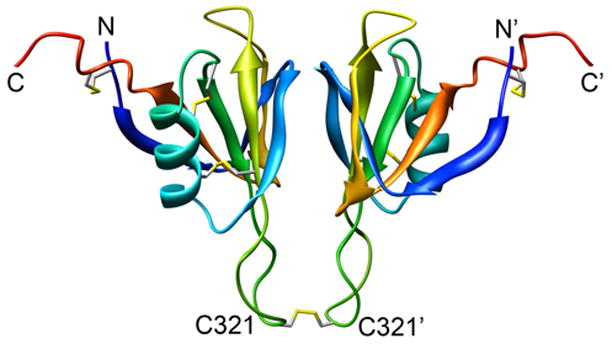
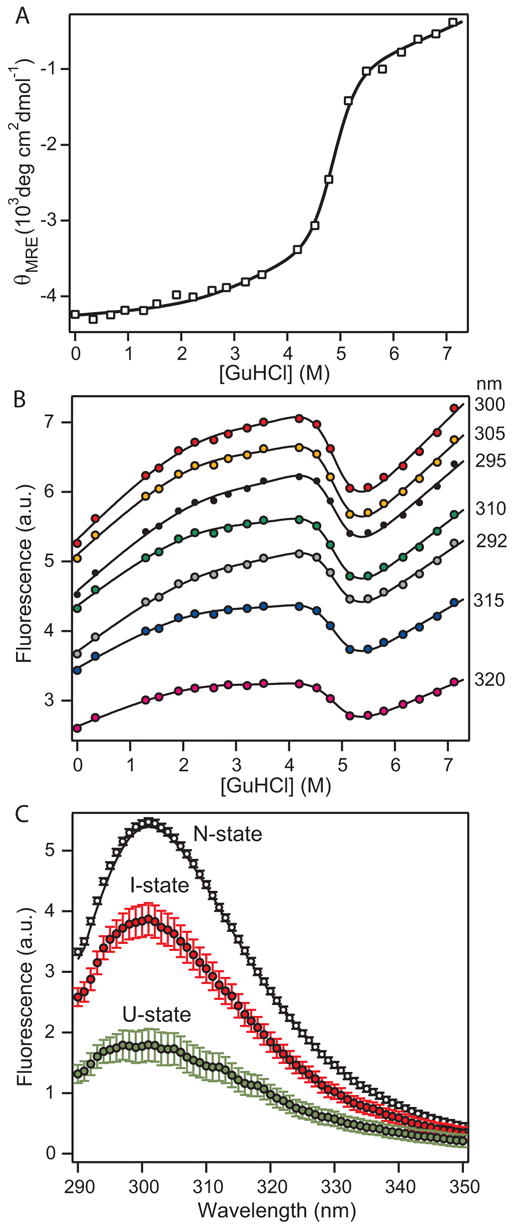
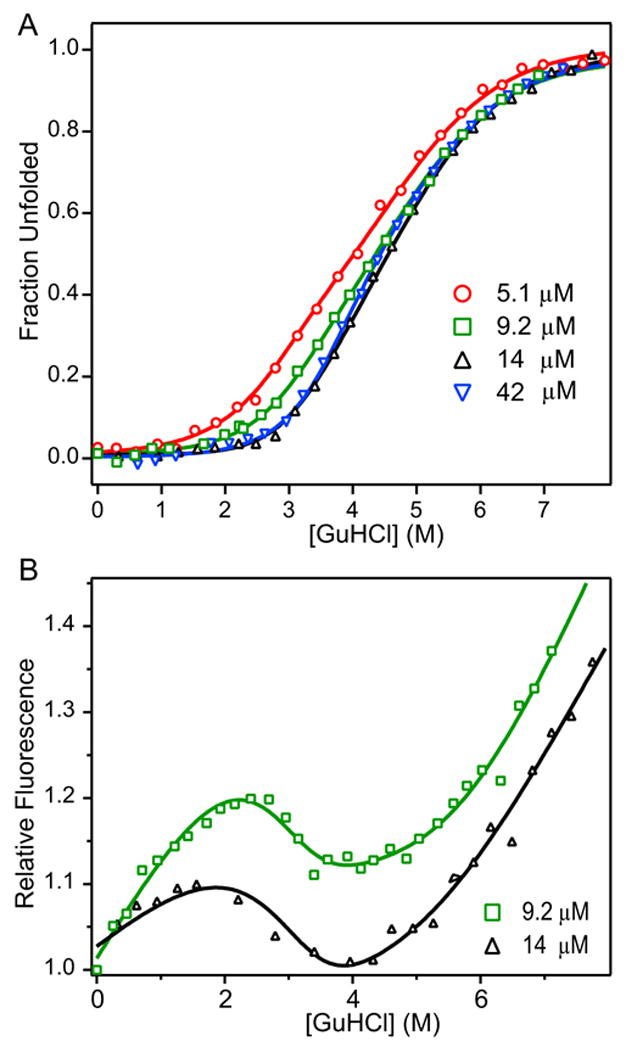
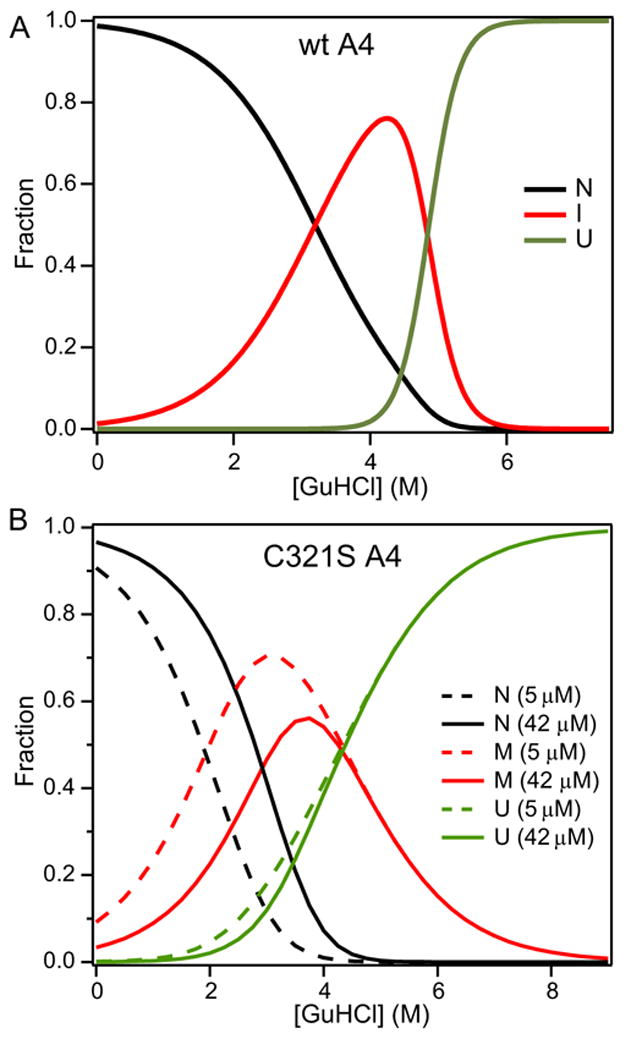
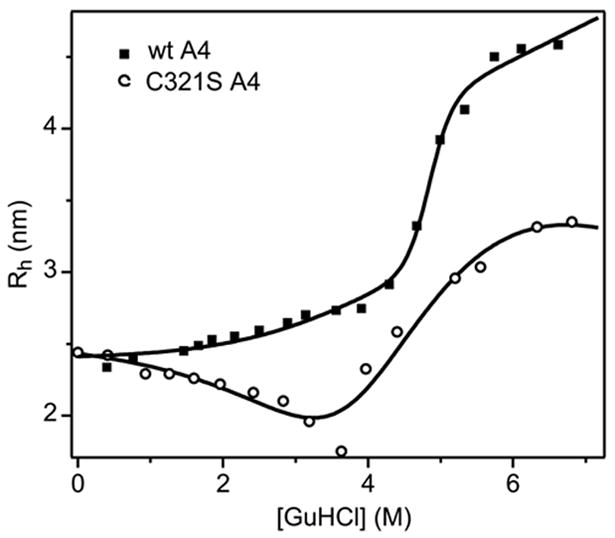
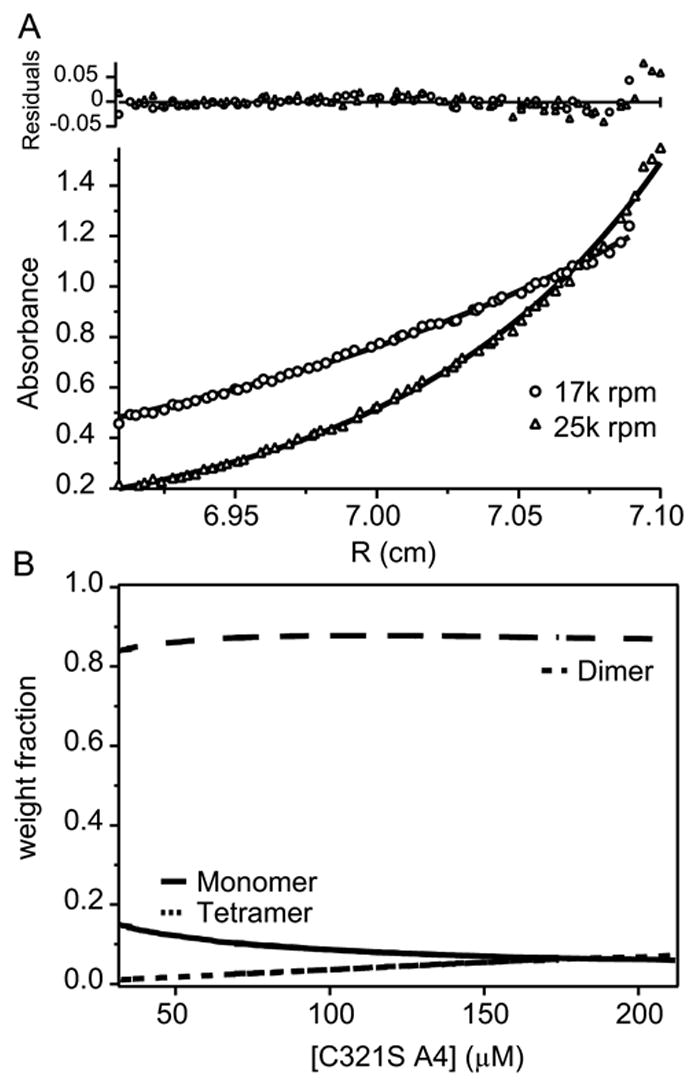
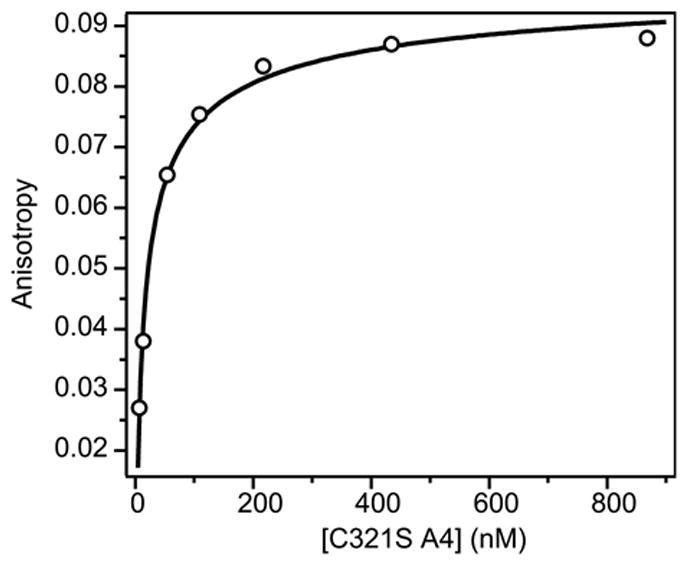
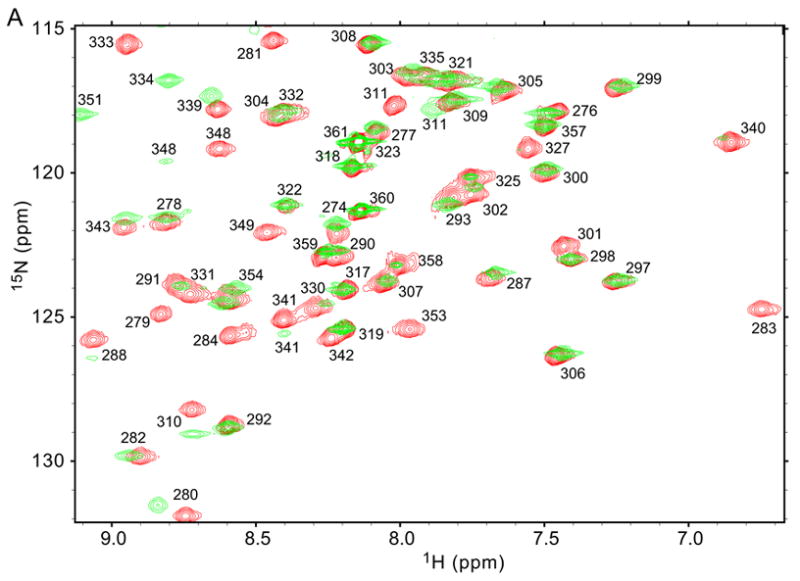
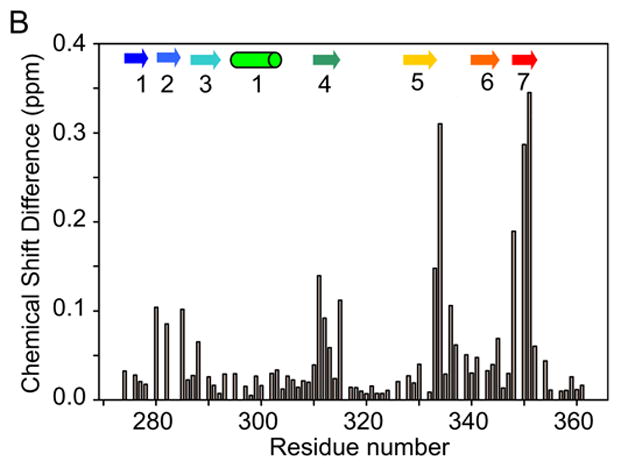
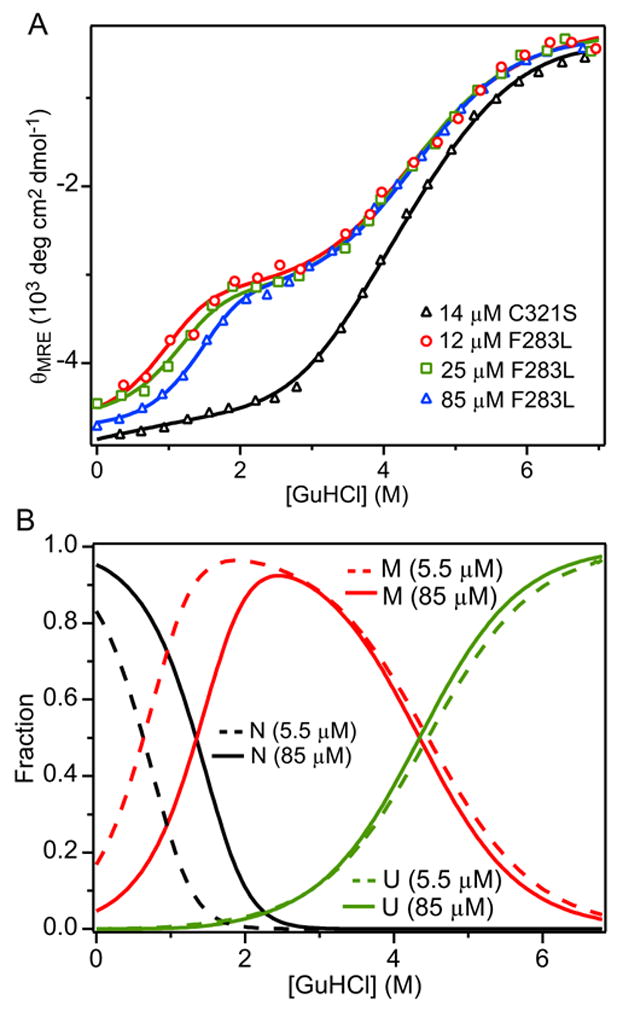
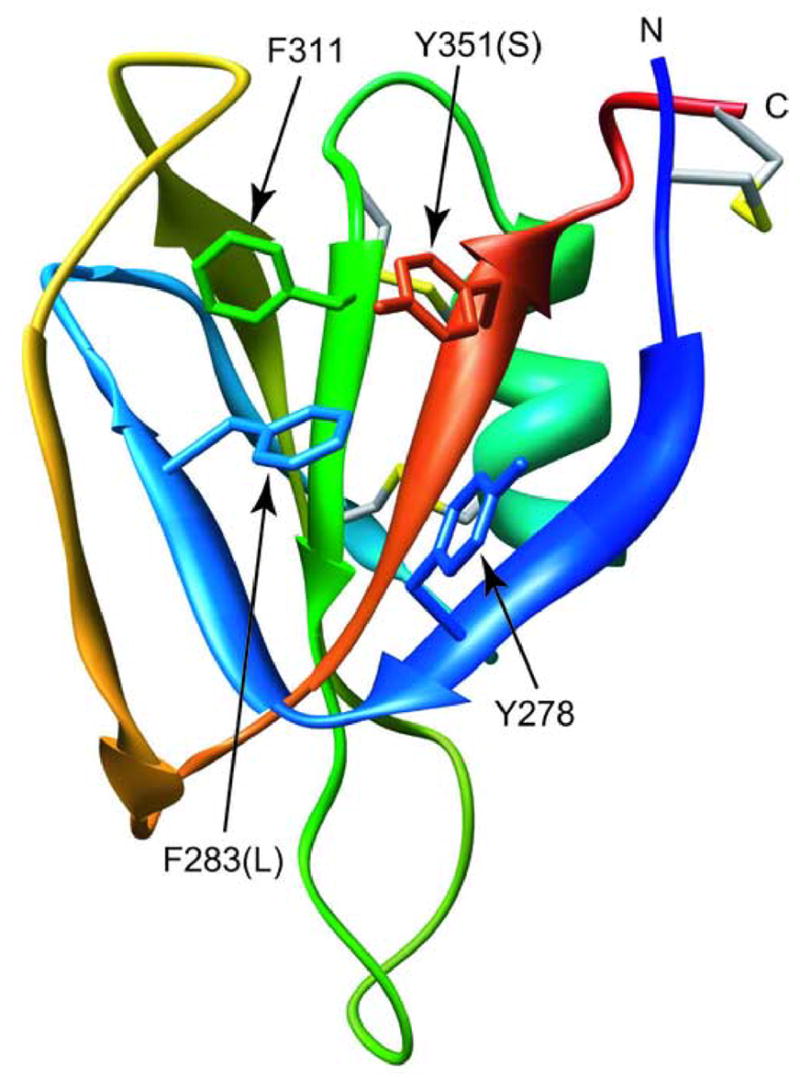
The blood coagulation protein factor XI (FXI) consists of a pair of disulfide-linked chains each containing four apple domains and a catalytic domain. The apple 4 domain (A4; F272-E362) mediates non-covalent homodimer formation even when the cysteine involved in an intersubunit disulfide is mutated to serine (C321S). To understand the role of non-covalent interactions stabilizing the FXI dimer, equilibrium unfolding of wild-type A4 and its C321S variant was monitored by circular dichroism, intrinsic tyrosine fluorescence and dynamic light scattering measurements as a function of guanidine hydrochloride concentration. Global analysis of the unimolecular unfolding transition of wild-type A4 revealed a partially unfolded equilibrium intermediate at low to moderate denaturant concentrations. The optically detected equilibrium of C321S A4 also fits best to a three-state model in which the native dimer unfolds via a monomeric intermediate state. Dimer dissociation is characterized by a dissociation constant, K(d), of approximately 90 nM (in terms of monomer), which is in agreement with the dissociation constant measured independently using fluorescence anisotropy. The results imply that FXI folding occurs via a monomeric equilibrium intermediate. This observation sheds light on the effect of certain naturally occurring mutations, such as F283L, which lead to intracellular accumulation of non-native forms of FXI. To investigate the structural and energetic consequences of the F283L mutation, which perturbs a cluster of aromatic side-chains within the core of the A4 monomer, it was introduced into the dissociable dimer, C321S A4. NMR chemical shift analysis confirmed that the mutant can assume a native-like dimeric structure. However, equilibrium unfolding measurements show that the mutation causes a fourfold increase in the K(d) value for dissociation of the native dimer and a 1 kcal/mol stabilization of the monomer, resulting in a highly populated intermediate. Since the F283 side-chain does not directly participate in the dimer interface, we propose that the F283L mutation leads to increased dimer dissociation by stabilizing a monomeric state with altered side-chain packing that is unfavorable for homodimer formation.


Figures

Figure 1
Figure 1
Ribbon diagram of the of the A4 dimer (residues F272 through E361 of FXI), based on the crystal structure of the FXI zymogen. Disulfide bonds, including the one linking the monomers via Cys321, are shown in stick representation.
Figure 2
Figure 2
GuHCl-induced unfolding/dimer dissociation of wt A4 monitored by CD and tyrosine fluorescence. A. Molar mean-residue ellipticity at 222 nm (θMRE) vs. GuHCl concentration. B. Tyrosine fluorescence signal at representative emission wavelengths vs. GuHCl concentration. The lines represent a global fit of the combined fluorescence data (transition curves at 1 nm increments from 290 to 390 nm) to a unimolecular three-state model of protein unfolding (equation 1). The optimized global fit parameter (Cm and m-values for each transition; Table 1) also reproduce the CD-detected unfolding curve (line in panel A). C. Intrinsic tyrosine fluorescence spectra in the absence of denaturant for each of the three equilibrium states obtained by global fitting of the combined fluorescence data.
Figure 3
Figure 3
Normalized ellipticity (A) and relative fluorescence (B) of C321S A4 protein as a function of GuHCl globally fitted to three-state dimeric model with monomeric intermediate. Normalized molar residue ellipticity (A) and relative fluorescence (B) of C321S A4 at 5.1 μM (red circles), 9.2 μM (green squares), 14 μM (black triangles), and 42 μM (blue inverted triangles) vs. GuHCl concentration. Data were fit to a three-state dimeric model of protein unfolding with a partially structured monomeric intermediate (Scheme 3, equation 4).
Figure 4
Figure 4
Relative populations of native (N, black lines), intermediate (I, red lines), and unfolded (U, green line) states of (A) wt A4 (20 μM) and (B) C321S A4 protein at 5.1 μM (dashed) and 42 μM (solid) as a function of GuHCl concentration. The populations for wt A4 (A) were calculated from a unimolecular three-state model (equation 1), using the parameters obtained by fitting the data in Figure 2. The population for the dissociable C321S mutant (B) were calculated from equation (4), which describes a three-state dimer-dissociation/unfolding transition with monmeric intermediate (Scheme 3), based on the fit of the CD and fluorescence data in Figure 2 (cf. Table 1).
Figure 5
Figure 5
Hydrodynamic radius (Rh) versus GuHCl concentration for 75 μM wt A4 (filled squares) and 100 μM C321S A4 (open circles) measured by DLS. The wt A4 data were fitted on the basis of the unimolecular three-state unfolding model (equation 1), while the fit to the C321S A4 data represents a three-state dimeric unfolding model with monomeric intermediate (equation 4). Both fits were constrained using the parameters obtained from the analysis of the CD and fluorescence data (Table 1).
Figure 6
Figure 6
Analytical ultracentrifugation sedimentation equilibrium (AUC SE) analysis of C321S A4. (A) Global fit of absorbance at 280 nm vs. the radial distance from the center of the centrifuge rotor to the sample cell measured at 17,000 rpm (circles) and 25,000 rpm (squares). (B) The fit parameters from panel A were used to calculate the relative fractions of monomeric (solid line), dimeric (long dashes), or tetrameric (short dashes) species vs. the total monomeric protein concentration in μM.
Figure 7
Figure 7
Dimer dissociation of fluorescence-labeled C321S A4 observed by fluorescence anisotropy. The fluorescence anisotropy of C321S A4-AF488 (circles) is plotted vs. total protein concentration in nM (per monomer). The line represents a fit of a dimer-monomer equilibrium model (equation 7).
Figure 8
Figure 8
NMR chemical shift analysis of F283L/C321S A4 in comparison to C321S A4. (A) Comparison of the 15N HSQC spectrum of F283L/C321S (green) with that of C321S A4 (red). Peak assignments were obtained by standard heteronuclear NMR techniques (see Methods). (B) Graph of 15NH normalized chemical shift differences between F283L/C321S A4 and C321S A4, calculated according to equation (8). Secondary structure elements are indicated using cylinders for α-helices arrows for β-strands, based on the crystal structure of FXI.
Figure 8
Figure 8
NMR chemical shift analysis of F283L/C321S A4 in comparison to C321S A4. (A) Comparison of the 15N HSQC spectrum of F283L/C321S (green) with that of C321S A4 (red). Peak assignments were obtained by standard heteronuclear NMR techniques (see Methods). (B) Graph of 15NH normalized chemical shift differences between F283L/C321S A4 and C321S A4, calculated according to equation (8). Secondary structure elements are indicated using cylinders for α-helices arrows for β-strands, based on the crystal structure of FXI.
Figure 9
Figure 9
Unfolding/dimer-dissociation equilibrium of F283L/C321S A4. (A) CD signal at 225 nm vs.GuHCl concentration measured at protein concentrations 12 μM (red circles), 25 μM (green squares), and 85 μM (blue triangles) along with global fits of a three-state unfolding model with monomeric intermediate (lines). The unfolding transition for 5.1 μM C321S A4 (cf. Figure 2A) is shown for comparison (black triangles). (B) Relative populations of native (black lines), intermediate (red lines), and unfolded (green lines) states for 5.48 μM (dashed) and 84.8 μM (solid) F283L/C321S A4 protein vs. GuHCl concentration obtained using the global fitting parameters in Table 1.
Figure 10
Figure 10
Ribbon diagram of a monomer of wt A4, based on the crystal structure of FXI. Side chains are shown for residues involved in an aromatic cluster, some of which are altered in FXI patient mutations (F283L, Y351S, as well as the adjacent G350A/E).

References

    1. Walsh PN, Gailani D. Factor XI. In: Colman RW, Hirsh J, Marder VJ, Clowes AW, George JN, editors. Hemostasis and Thrombosis: Basic Principles and Clinical Practice. 5. Chapter 12. Lippincott Williams & Wilkins; Philadelphia: 2006.
    1. Fujikawa K, Legaz ME, Kato H, Davie EW. The mechanism of activation of bovine factor IX (Christmas factor) by bovine factor XIa (activated plasma thromboplastin antecedent) Biochemistry. 1974;13:4508–16. - PubMed
    1. Gailani D, Broze GJ., Jr Factor XI activation in a revised model of blood coagulation. Science. 1991;253:909–12. - PubMed
    1. Naito K, Fujikawa K. Activation of human blood coagulation factor XI independent of factor XII. Factor XI is activated by thrombin and factor XIa in the presence of negatively charged surfaces. J Biol Chem. 1991;266:7353–8. - PubMed
    1. Papagrigoriou E, McEwan PA, Walsh PN, Emsley J. Crystal structure of the factor XI zymogen reveals a pathway for transactivation. Nat Struct Mol Biol. 2006;13:557–8. - PubMed

Publication types

LinkOut - more resources