

Does cochlear implantation and electrical stimulation affect residual hair cells and spiral ganglion neurons?
- PMID: 17258411
- PMCID: PMC1853285
- DOI: 10.1016/j.heares.2006.12.004
Does cochlear implantation and electrical stimulation affect residual hair cells and spiral ganglion neurons?
Abstract
Increasing numbers of cochlear implant subjects have some level of residual hearing at the time of implantation. The present study examined whether (i) hair cells that have survived one pathological insult (aminoglycoside deafening), can survive and function following long-term cochlear implantation and electrical stimulation (ES); and (ii) chronic ES in these cochleae results in greater trophic support of spiral ganglion neurons (SGNs) compared with cochleae devoid of hair cells. Eight cats, with either partial (n=4) or severe (n=4) sensorineural hearing loss, were bilaterally implanted with scala tympani electrode arrays 2 months after deafening, and received unilateral ES using charge balanced biphasic current pulses for periods of up to 235 days. Frequency-specific compound action potentials and click-evoked auditory brainstem responses (ABRs) were recorded periodically to monitor the residual acoustic hearing. Electrically evoked ABRs (EABRs) were recorded to confirm the stimulus levels were 3-6 dB above the EABR threshold. On completion of the ES program the cochleae were examined histologically. Partially deafened animals showed no significant increase in acoustic thresholds over the implantation period. Moreover, chronic ES of an electrode array located in the base of the cochlea did not adversely affect hair cells in the middle or apical turns. There was evidence of a small but statistically significant rescue of SGNs in the middle and apical turns of stimulated cochleae in animals with partial hearing. Chronic ES did not, however, prevent a reduction in SGN density for the severely deaf cohort, although SGNs adjacent to the stimulating electrodes did exhibit a significant increase in soma area (p<0.01). In sum, chronic ES in partial hearing animals does not adversely affect functioning residual hair cells apical to the electrode array. Moreover, while there is an increase in the soma area of SGNs close to the stimulating electrodes in severely deaf cochleae, this trophic effect does not result in increased SGN survival.
Figures
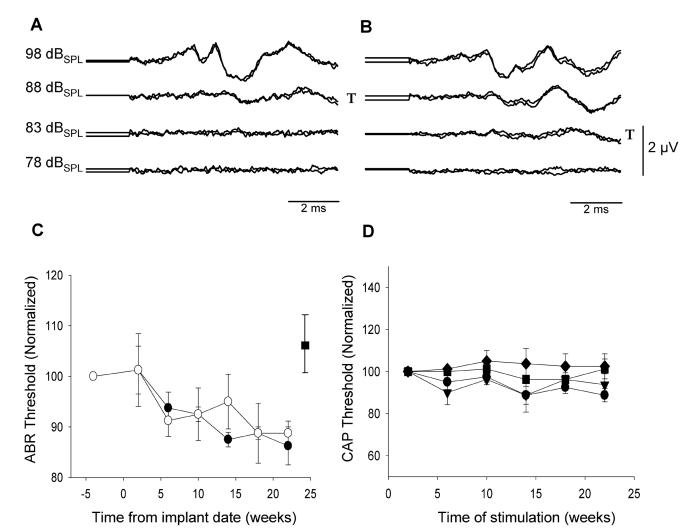
A and B: Representative examples of click-evoked ABRs recorded prior to implantation (A) and at the end of ES, 195 days post implant surgery (B; I6p). T= denotes threshold.
C: Normalized ABR thresholds as a function of implantation time for ES (●) and non-stimulated (○) cochleae of partially deaf animals (n= 4; mean ± sem). Click thresholds exhibited a statistically significant reduction as a function of implantation time. This reduction was not influenced by chronic ES.
D: CAP thresholds recorded from the stimulated cochleae as a function of implantation time: 0.5 KHz ●; 1.0 KHz▼; 2.0 KHz■ ; 4.0 KHz◆. (n= 4; normalized mean ± sem). CAP thresholds showed no significant change over time.
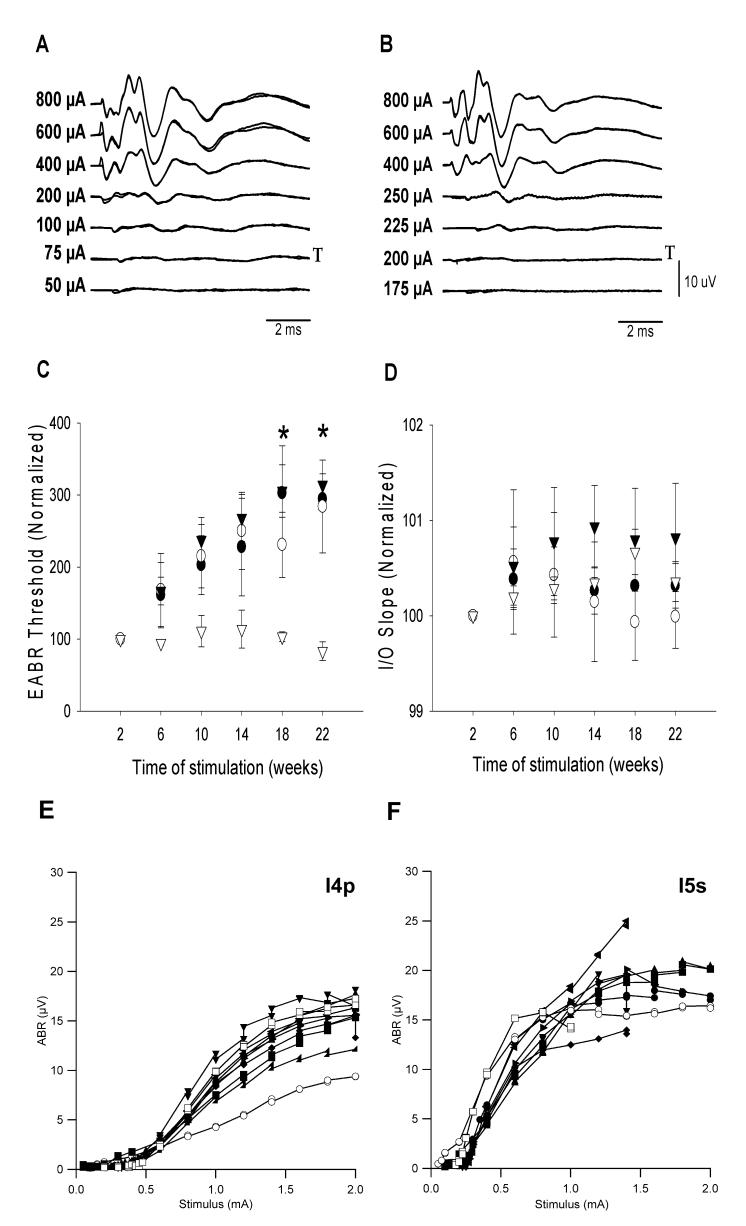
A & B: Representative EABRs recorded post operatively (A) and at the completion of ES, 195 days later (B; I5s). T= threshold.
C: Change in EABR threshold normalized to the first post-operative response as a function of implant time (n=6; mean ± sem; * = p<0.05).
D: Change in the gradient of the normalized input-output function (I/O) curve as a function of stimulation time (n=6; mean ± sem). ● Recorded from apical electrodes of broad ES group: (electrodes 1-3); ○ Recorded from basal electrodes of broad ES group (electrodes 6-8); ▼Recorded from apical electrodes of narrow ES group (electrodes 1-3); ▽ Recorded from basal electrodes of narrow ES group (electrodes 6-8).
E (I4p) & F (I5s): Two representative EABR I/O functions plotted periodically over the course of their chronic stimulation program. Open symbols are used to identify the first and last I/O recordings for each animal.
Similar articles
-
Chronic electrical stimulation of the auditory nerve at high stimulus rates: a physiological and histopathological study.Hear Res. 1997 Mar;105(1-2):1-29. doi: 10.1016/s0378-5955(96)00193-1. Hear Res. 1997. PMID: 9083801
-
Cochlear pathology following chronic electrical stimulation of the auditory nerve: II. Deafened kittens.Hear Res. 1994 Dec;81(1-2):150-66. doi: 10.1016/0378-5955(94)90162-7. Hear Res. 1994. PMID: 7737922
-
Evaluation of focused multipolar stimulation for cochlear implants: a preclinical safety study.J Neural Eng. 2017 Aug;14(4):046020. doi: 10.1088/1741-2552/aa7586. J Neural Eng. 2017. PMID: 28607224 Free PMC article.
-
Effect of chronic electrical stimulation on cochlear nucleus neuron size in normal hearing kittens.Acta Otolaryngol. 1993 Jul;113(4):489-97. doi: 10.3109/00016489309135851. Acta Otolaryngol. 1993. PMID: 8379304 Review.
-
An overview of cochlear implant electrode array designs.Hear Res. 2017 Dec;356:93-103. doi: 10.1016/j.heares.2017.10.005. Epub 2017 Oct 18. Hear Res. 2017. PMID: 29102129 Review.
Cited by
-
[Transcorneal electrostimulation].Ophthalmologe. 2012 Feb;109(2):129-35. doi: 10.1007/s00347-011-2450-6. Ophthalmologe. 2012. PMID: 22350549 German.
-
The effect of cochlear-implant-mediated electrical stimulation on spiral ganglion cells in congenitally deaf white cats.J Assoc Res Otolaryngol. 2010 Dec;11(4):587-603. doi: 10.1007/s10162-010-0234-3. Epub 2010 Sep 4. J Assoc Res Otolaryngol. 2010. PMID: 20821032 Free PMC article.
-
Magnetic Beads Enhance Adhesion of NIH 3T3 Fibroblasts: A Proof-of-Principle In Vitro Study for Implant-Mediated Long-Term Drug Delivery to the Inner Ear.PLoS One. 2016 Feb 26;11(2):e0150057. doi: 10.1371/journal.pone.0150057. eCollection 2016. PLoS One. 2016. PMID: 26918945 Free PMC article.
-
Response of the flat cochlear epithelium to forced expression of Atoh1.Hear Res. 2008 Jun;240(1-2):52-6. doi: 10.1016/j.heares.2008.02.007. Epub 2008 Mar 7. Hear Res. 2008. PMID: 18430530 Free PMC article.
-
Feline deafness.Vet Clin North Am Small Anim Pract. 2012 Nov;42(6):1179-207. doi: 10.1016/j.cvsm.2012.08.008. Epub 2012 Oct 9. Vet Clin North Am Small Anim Pract. 2012. PMID: 23122176 Free PMC article. Review.
References
-
- Araki S, Kawano A, Seldon L, Shepherd RK, Funasaka S, Clark GM. Effects of chronic electrical stimulation on spiral ganglion neuron survival and size in deafened kittens. Laryngoscope. 1998;108:687–95. - PubMed
-
- Black RC, Clark GM, O'Leary SJ, Walters C. Intracochlear electrical stimulation of normal and deaf cats investigated using brainstem response audiometry. Acta Oto-Laryngologica. 1983;(Supplement 399):5–17. - PubMed
-
- Boggess WJ, Baker JE, Balkany TJ. Loss of residual hearing after cochlear implantation. Laryngoscope. 1989;99:1002–5. - PubMed
-
- Brown M, Shepherd RK, Webster WR, Martin RL, Clark GM. Cochleotopic selectivity of a multichannel scala tympani electrode array using the 2-deoxyglucose technique. Hear Res. 1992;59:224–40. - PubMed
-
- Clark GM, Shute SA, Shepherd RK, Carter TD. Cochlear implantation: osteoneogenesis, electrode-tissue impedance, and residual hearing. Ann Otol Rhinol Laryngol Suppl. 1995;166:40–2. - PubMed
Publication types
MeSH terms
Substances
Grants and funding
LinkOut - more resources
Full Text Sources
Medical
Miscellaneous
