. 2007 Mar 15;303(2):727-39.
doi: 10.1016/j.ydbio.2006.12.009. Epub 2006 Dec 9.

Spatio-temporal localization of membrane lipid rafts in mouse oocytes and cleaving preimplantation embryos

Affiliations

Spatio-temporal localization of membrane lipid rafts in mouse oocytes and cleaving preimplantation embryos

Martina Comiskey et al. Dev Biol. .

Abstract

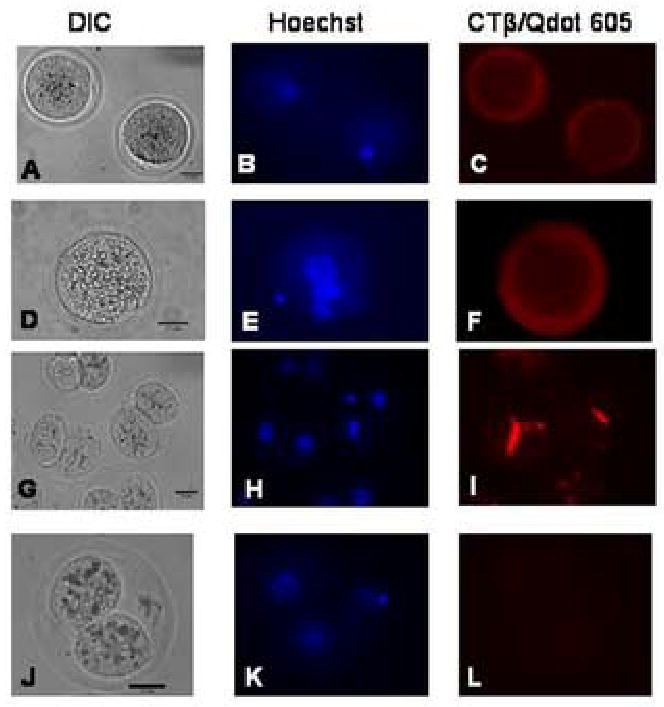
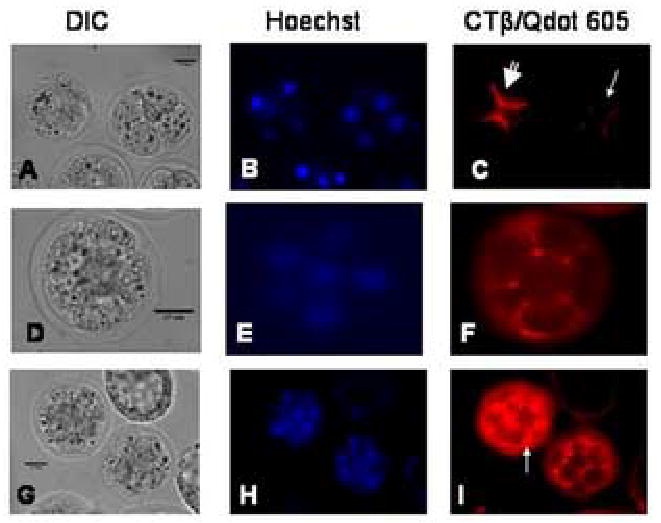
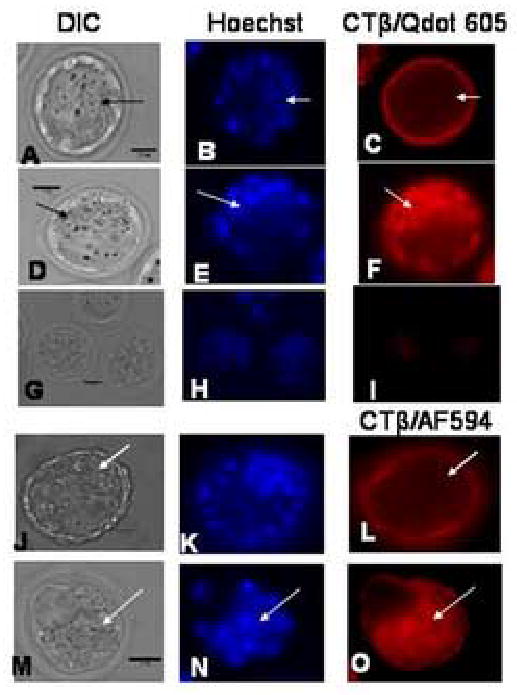
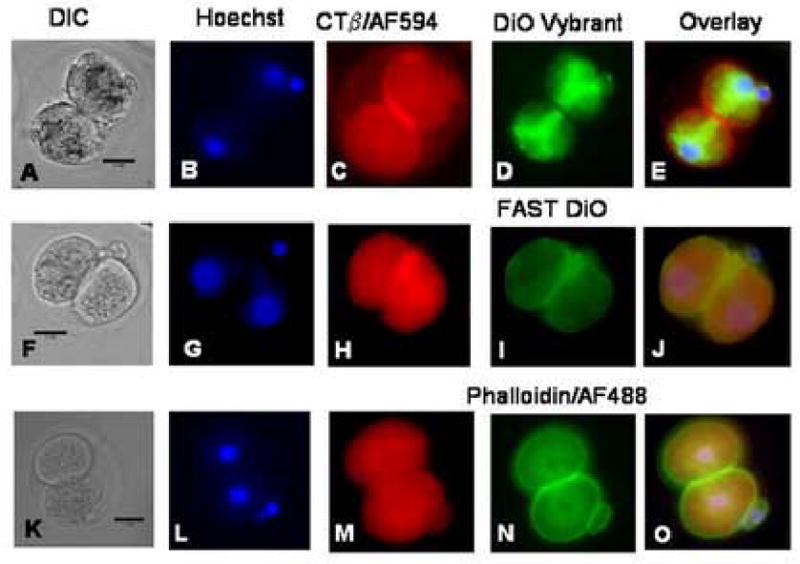
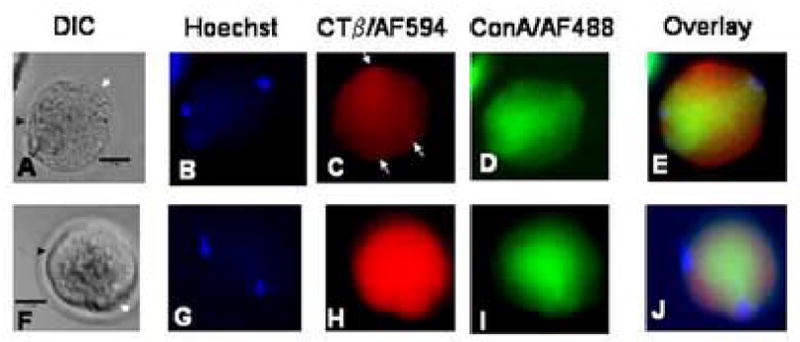
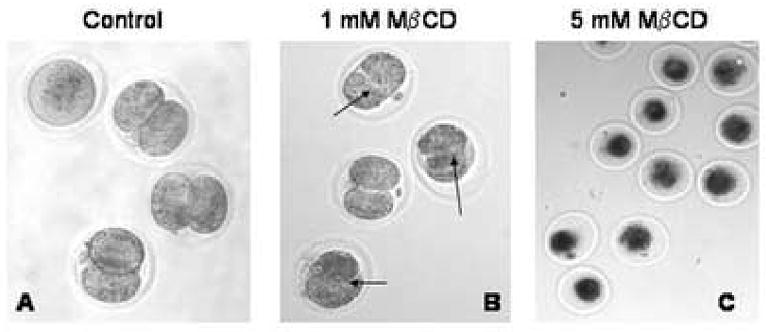
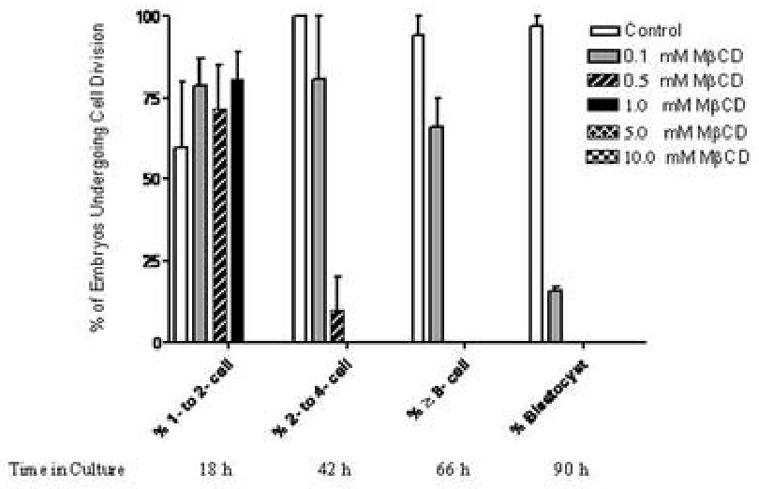
We report for the first time the detection of membrane lipid rafts in mouse oocytes and cleaving preimplantation embryos. Cholera toxin beta (CTbeta), which binds to the raft-enriched ganglioside GM1, was selected to label rafts. In a novel application a Qdot reagent was used to detect CTbeta labeling. This is the first reported use of nanocrystals in mammalian embryo imaging. Comparative membrane labeling with CTbeta and lipophilic membrane dyes containing saturated or unsaturated aliphatic tails showed that the detection of GM1 in mouse oocytes and embryo membranes was consistent with the identification of cholesterol- and sphingolipid-enriched rafts in the cell membrane. Distribution of the GM1 was compared with the known distribution of non-raft membrane components, and disruption of membrane rafts with detergents confirmed the cholesterol dependence of GM1 on lipid raft labeling. Complementary functional studies showed that cholesterol depletion using methyl-beta-cyclodextrin inhibited preimplantation development in culture. Our results show that the membranes of the mouse oocyte and zygote are rich in lipid rafts, with heterogeneous and stage-dependent distribution. In dividing embryos, the rafts were clearly associated with the cleavage furrow. At the morula stage, rafts were also apically enriched in each blastomere. In blastocysts, rafts were detectable in the trophectoderm layer, but could not be detected in the inner cell mass without prior fixation and permeabilization of the embryo. Lipid rafts and their associated proteins are, therefore, spatio-temporally positioned to a play a critical role in preimplantation developmental events.


Figures

Figure 1
Figure 1
Lipid Rafts in oocytes, zygotes, and 2-cell embryos labeled with Qdots. The data are presented in rows of images from the same samples, where the image on the left is the DIC image, the image in the middle is cell nuclei labeled with Hoechst 33342, and the image on the right is lipid raft labeling using biotinylated CTβ and streptavidin-conjugated Qdot 605 nanoparticles. The scale bar (25 μm) is shown in the DIC image in each set of images. A–C: Oocytes, showing uniform labeling of rafts in the cell membrane at 30–33 h post hCG. The images shown are representative of 12 oocytes from one experiment. Seven control oocytes were also labeled with Qdots in the absence of biotinylated CTβ to confirm the specificity of the staining. D–F: Zygote, showing uniform labeling of the cell membrane, similar to that seen in oocytes. Eleven sample zygotes and ten controls were used for the experiment represented in the image, at 30 h post hCG. G–I: 2-cell embryos completing the first cell division from zygote to 2-cell, showing enrichment of lipid rafts at the cleavage furrow. Twenty six sample embryos and 20 controls at 30 h post hCG were used for the experiment represented in the images. J–L: Representative control staining of a 2-cell embryo labeled with Qdots in the absence of biotinylated CTβ to confirm the specificity of the staining.
Figure 2
Figure 2
Lipid rafts in 4-cell, 6-cell, and morula stage embryos labeled with Qdots. Twelve sample embryos and six controls at 61 h post hCG were used for the experiment represented in the images. A–C: 4-cell embryos showing enrichment of lipid rafts at the cleavage furrow. In C, the large arrow indicates an embryo actively undergoing cytokinesis; the smaller arrow shows an embryo where cytokinesis is nearing completion. The scale bar (25 μm) is shown in the DIC image in each set of images. D–F: A 6-cell embryo showing raft enrichment at the cleavage furrow. G–I: Morula stage embryos showing lipid raft enrichment at the cleavage furrow and at the apical edge of the blastomeres (see arrow). Nine sample and 3 control morulae at 89 h post hCG were used for the experiment represented in the images.
Figure 3
Figure 3
Lipid rafts in blastocyst stage embryos, non-permeabilized and permeabilized, labeled with Qdots and AF594. The scale bar (25 μm) is shown in the DIC image in each set of images. A–C: Non-permeabilized blastocyst with lipid rafts imaged with Qdots. The lipid raft staining is confined to the trophectoderm (TE) with none apparent in the inner cell mass (ICM). The ICM is indicated by arrows. Seventeen blastocyst and five controls at 91 h post hCG were used for the experiment represented in the images. D–F: Permeabilized blastocyst with lipid rafts imaged with Qdots. The lipid raft staining is found on both the TE and ICM. The ICM is indicated by arrows. Ten blastocyst and five controls at 91 h post hCG were used for the experiment represented in the images. G–I: Representative control staining of blastocysts labeled with Qdots in the absence of biotinylated CTβ to confirm the specificity of the staining. Ten blastocyst and five controls at 91 h post hCG were used for the experiment represented in the images J–L: Non-permeabilized blastocysts with lipid rafts imaged with CTβ/AF594. The lipid raft staining is confined to the TE with none apparent in the ICM. The ICM is indicated by arrows. M–O: Permeabilized blastocyst with lipid rafts imaged with CTβ/AF594. The lipid raft staining is found on both the TE and ICM. The ICM is indicated by arrows. A total of 32 sample and 7 control blastocysts at 91 h post hCG were used for the experiment represented in the images.
Figure 4
Figure 4
Lipid rafts in 2-cell embryos stained with Vybrant DiO, FAST DiO and phalloidin/AF488 reagents simultaneously with CTβ/AF594. The data are presented in rows of images from the same samples, where the image on the left is the DIC image, the second image is of the cell nuclei labeled with Hoechst 33342, the third image is lipid raft labeling using CTβ/AF594, the fourth image shows the Vybrant DiO, FAST DiO or phalloidin/AF488 labeling and the final image is an overlay of the three preceeding images. Co-localization of reagents is indicated in yellow in the overlay images. The scale bar (25 μm) is shown in the DIC image in each set of images. A–E: 2-cell embryo labeled with Hoechst, CTβ/AF594 and Vybrant DiO reagent. The CTβ/AF594 labeling is in the cell membrane, and concentrated in the furrow region. The Vybrant DiO reagent did not label the cell membrane but instead labeled the endoplasmic reticulum, which is being distributed between the daughter cells after cytokinesis along the mitotic spindle (D). The absence of co-localization of the labeling reagents is apparent in the overlay image (E). Fifteen 2-cell embryos and ten controls at 30 h post hCG were used for the experiment represented in the images. F–J: 2-cell embryo labeled with Hoechst, CTβ/AF 594 and FAST DiO reagent. Intracellular labeling with CTβ/AF 594 is apparent in this sample (H), and co-localization of the cholera toxin labeling and FAST DiO is seen in the cell membrane (J). The nuclei appear pink in this overlay image. Little intracellular staining with FAST DiO is visible (I). Thirteen 2-cell samples (30 h post hCG) and 18 controls were imaged for the experiment represented in the images. K–O: 2-cell embryo labeled with Hoechst, CTβ/AF594 and phalloidin/AF488. The embryos were fixed and permeabilized with Triton X-100 before the labeling reagents were applied. CTβ/AF594 labeling in this experiment was more apparent intracellularly than in the cell membrane (M). The permeabilization with Triton X-100 effectively disrupted the membrane distribution of rafts labeled with GM1 (M). The expected predominantly cortical distribution of actin labeled with phalloidin/AF488 was seen (N). Fifteen two cell embryos and seven unpermeablized control embryos were imaged for the experiment shown.
Figure 5
Figure 5
Lipid rafts in zygotes stained with ConA/AF488 for lectin simultaneously with CTβ/AF594. The data are presented in rows of images from the same samples, where the image on the left is the DIC image, the second image is of the cell nuclei labeled with Hoechst 33342, the third image is lipid raft labeling using CTβ/AF594, the fourth image shows staining with ConA/AF488 and the final image is an overlay of the three preceeding images. Co-localization of reagents labeled with CTβ/AF594 and ConA/AF488 is indicated in yellow in the overlay images. The scale bar (25 μm) is shown in the DIC image in each set of images. A–E: Zygote labeled with Hoechst, CTβ/AF594 and ConA/AF488. In the DIC image (A), the sperm entry point is labeled with a black arrowhead, and the nipple region where the second polar body will be extruded is shown with a white arrowhead. In the Hoechst-labeled image (B), the metaphase plate under the nipple and the sperm head can be seen, corresponding with the arrows in A. CTβ/AF594 labeling appears diffuse in the membrane with some regions of strong focal staining in the cell membrane as shown by the arrows (C). Lectin labeling with ConA/AF488 was diffuse, and intracytoplasmic staining appears to predominate (D). In the overlay image (E), it is apparent that there are distinct patterns of distribution of lectin labeled with ConA/AF488 and lipid rafts labeled with CTβ/AF594. F–J: Zygote labeled with Hoechst, CTβ/594 and ConA/AF488 after treatment with saponin. In the DIC image (F), the sperm entry point is labeled with a black arrowhead, and the nipple region with a white arrowhead. The oocyte metaphase plate and the sperm head are visible in the Hoechst-labeled image (G). CTβ/AF594 labeling is diffuse after saponin treatment (H), and no defined regions of stronger focal CTβ staining can be seen in the membrane, in contrast to the image in C in the absence of saponin. Lectin labeling with ConA/AF488 after saponin treatment is similar with that of the untreated sample (I), and in the overlay image it is apparent that the distribution of CTβ-labeled lipid rafts has been disrupted by the saponin treatment step (J). Twenty threes sample zygotes and 17 controls at 24–30 h post hCG were used for the experiments described.
Figure 6
Figure 6
Effect of MβCD on preimplantation embryo development in culture. A. Representative DIC image of control embryos after 18 h in culture in KSOMAA in the absence of MβCD. B. Embryos after 18 h in culture in KSOMAA with 1mM MβCD, showing that cytokinesis was compromised compared with the controls in A. C. Embryos after 18 h in culture in KSOMAA with 5 mM MβCD. This concentration of MβCD was clearly toxic to the embryos.
Figure 7
Figure 7
Effect of MβCD on preimplantation embryo development in culture. Results for control embryos are shown in white bars, embryos cultured in 0.1mM MβCD in grey bars, in 0.5 mM MβCD in striped bars, in 1.0 mM MβCD in black bars, in 5 mM MβCD in cross-hatched bars and 10 mM MβCD in checkered bars. The X-axis records the percentages of embryos that successfully completed the sequential transition from 1- to 2-cell, 2- to 4-cell, 4- to 8-cell, and 8-cell to blastocyst stage. Below the X-axis label, the time in culture is also noted. The Y-axis records the % of embryos undergoing cell division. Thirty to forty embryos were cultured for each concentration of MβCD and each control sample in each of the two experiments included in these data.

Similar articles

Cited by

References

    1. Albertson R, et al. Membrane traffic: a driving force in cytokinesis. Trends Cell Biol. 2005;15:92–101. - PubMed
    1. Allworth A, Ziomek CA. Filipin-labelled complexes are polarized in their distribution in the cytoplasm of meiotically mature mouse eggs. Gamete Res. 1988;20:475–89. - PubMed
    1. Belton RJ, Jr, et al. Isolation and characterization of sea urchin egg lipid rafts and their possible function during fertilization. Mol Reprod Dev. 2001;59:294–305. - PubMed
    1. Bradford GE, Nott CF. Genetic control of ovulation rate and embryo survival in mice. II. Effects of crossing selected lines. Genetics. 1969;63:907–18. - PMC - PubMed
    1. Brown DA, London E. Functions of lipid rafts in biological membranes. Annu Rev Cell Dev Biol. 1998;14:111–36. - PubMed

Publication types

LinkOut - more resources