. 2007 Jan;19(1):84-93.
doi: 10.1105/tpc.106.048157. Epub 2007 Jan 26.

CRYPTOCHROME2 in vascular bundles regulates flowering in Arabidopsis

Affiliations

CRYPTOCHROME2 in vascular bundles regulates flowering in Arabidopsis

Motomu Endo et al. Plant Cell. 2007 Jan.

Abstract

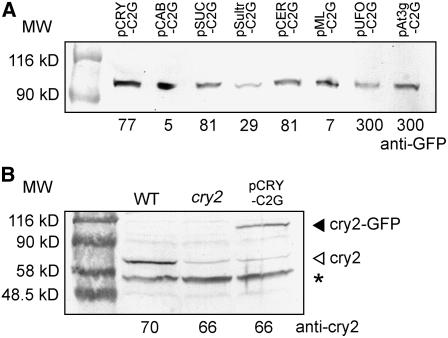
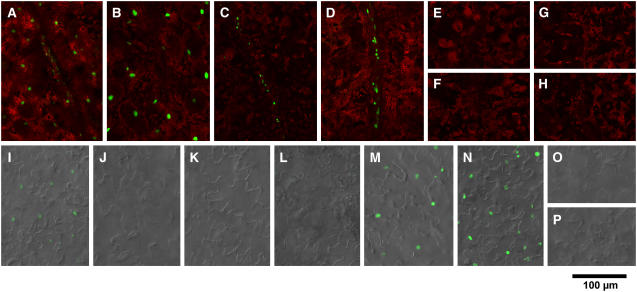
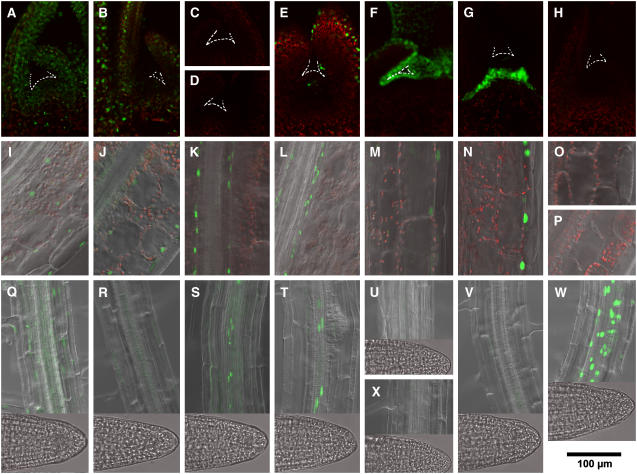
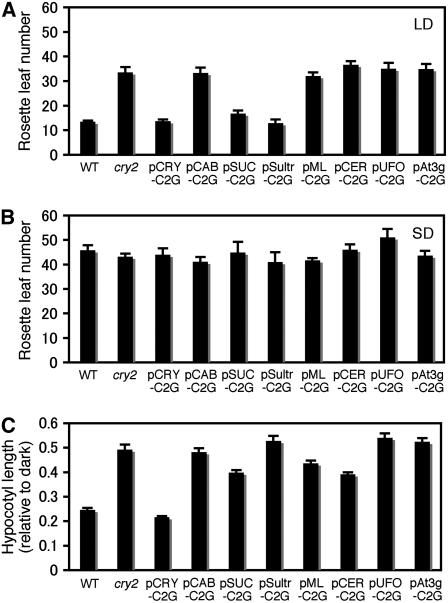
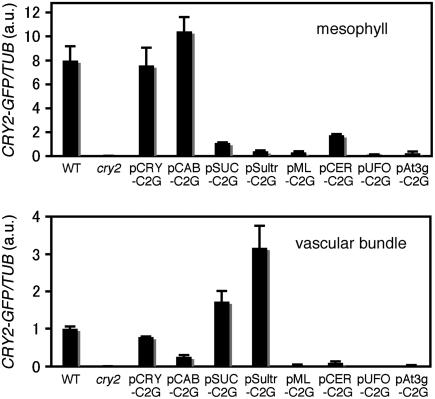
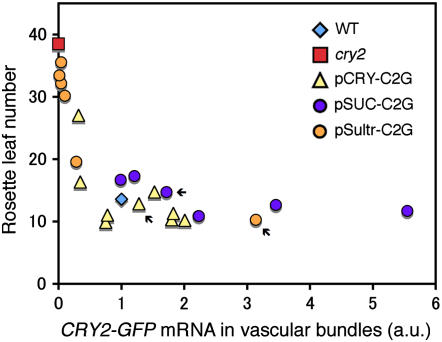
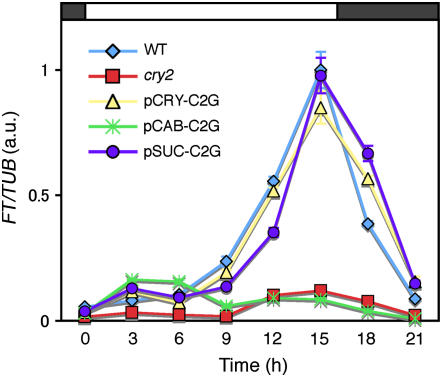
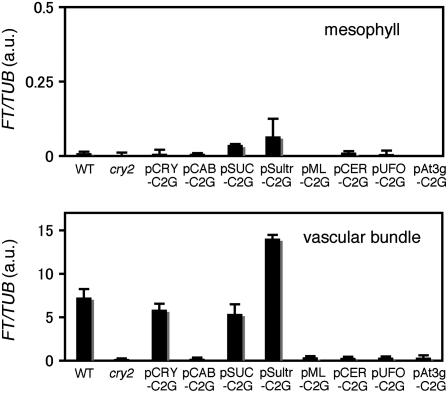
Plants make full use of light signals to determine the timing of flowering. In Arabidopsis thaliana, a blue/UV-A photoreceptor, CRYPTOCHROME 2 (cry2), and a red/far-red photoreceptor, PHYTOCHROME B (phyB), are two major photoreceptors that control flowering. The light stimuli for the regulation of flowering are perceived by leaves. We have recently shown that phyB expression in mesophyll but not in vascular bundles suppresses the expression of a key flowering regulator, FLOWERING LOCUS T (FT), in vascular bundles. In this study, we asked where in the leaf cry2 perceives light stimuli to regulate flowering. To answer this question, we established transgenic Arabidopsis lines in which the cry2-green fluorescent protein (GFP) fusion was expressed under the control of organ/tissue-specific promoters in a cry2-deficient mutant background. Analysis of these lines revealed that expression of cry2-GFP in vascular bundles, but not in epidermis or mesophyll, rescued the late flowering phenotype. We further confirmed that cry2-GFP expressed in vascular bundles increased FT expression only in vascular bundles. Hence, in striking contrast with phyB, cry2 most likely regulates FT expression in a cell-autonomous manner.


Figures

Figure 1.
Figure 1.
Immunoblot Detection of cry2-GFP and Endogenous cry2. Proteins were extracted from 10-d-old seedlings grown under LD. The numbers below the panel indicate loading amounts of the proteins (μg). MW, molecular mass (kD). The lines shown are pCRY-C2G-16, pCAB-C2G-6, pSUC-C2G-2, pSultr-C2G-10, pML-C2G-6, pCER-C2G-8, pUFO-C2G-13, and pAt3g-C2G-7. (A) Immunoblotting analysis with an anti-GFP antibody. (B) Immunoblotting analysis with an anti-cry2 antibody. The asterisk indicates nonspecific bands.
Figure 2.
Figure 2.
Confocal Microscopic Observation of cry2-GFP Nuclear Accumulation (Guo et al., 1999) in Mesophyll, Vascular Bundles, and Epidermis of Cotyledons. Seedlings were grown for 10 d under LD. Green fluorescence from GFP and red fluorescence from chlorophyll were overlaid electronically. In addition, differential interference contrast images were overlaid for epidermis. Seedlings of pCRY-C2G-16 ([A] and [I]), pCAB-C2G-6 ([B] and [J]), pSUC-C2G-2 ([C] and [K]), pSultr-C2G-10 ([D] and [L]), pML-C2G-6 ([E] and [M]), pCER-C2G-8 ([F] and [N]), pUFO-C2G-13 ([G] and [O]), and pAt3g-C2G-7 ([H] and [P]) are shown. Bar = 100 μm. (A) to (H) cry2-GFP fluorescence in mesophyll/vascular bundles. (I) to (P) cry2-GFP fluorescence in epidermis.
Figure 3.
Figure 3.
Confocal Microscopic Observation of cry2-GFP Nuclear Accumulation (Guo et al., 1999) in Shoot Apex, the Hypoctyl, and the Root. Seedlings were grown for 10 d under LD. Green fluorescence from GFP and red fluorescence from chlorophyll were overlaid electronically. In addition, differential interference contrast images were overlaid for hypocotyl and root. Images of pCRY-C2G-16 ([A], [I], and [Q]), pCAB-C2G-6 ([B], [J], and [R]), pSUC-C2G-2 ([C], [K], and [S]), pSultr-C2G-10 ([D], [L], and [T]), pML-C2G-6 ([E], [M], and [U]), pCER-C2G-8 ([F], [N], and [X]), pUFO-C2G-13 ([G], [O], and [V]), and pAt3g-C2G-7 ([H], [P], and [W]) seedlings are shown. Bar = 100 μm. (A) to (H) cry2-GFP fluorescence in the shoot apex. Dotted lines indicate the edges of shoot apex and leaf primordia. (I) to (P) cry2-GFP fluorescence in the hypocotyl. (Q) to (X) cry2-GFP fluorescence in the root and root tip.
Figure 4.
Figure 4.
Flowering Times and Hypocotyl Lengths in the Lines Expressing cry2-GFP in Specific Organs/Tissues. (A) and (B) Flowering times were scored by determining the number of rosette leaves when the first flower opened. The number is inversely correlated with the flowering time. Plants were grown under LD (A) or SD (B). Mean ± se (n ≥ 15). (C) Hypocotyl lengths of seedlings grown under continuous blue light for 7 d. Mean ± se (n = 25). The lines shown are pCRY-C2G-16, pCAB-C2G-6, pSUC-C2G-2, pSultr-C2G-10, pML-C2G-6, pCER-C2G-8, pUFO-C2G-13, and pAt3g-C2G-7.
Figure 5.
Figure 5.
CRY2-GFP mRNA Expression in Mesophyll and Vascular Bundles. Mesophyll protoplasts (top panel) and vascular bundles (bottom panel) were isolated from cotyledons in the seedlings grown for 10 d under LD. The samples were analyzed by quantitative RT-PCR. The averages of three biological replicates are shown. TUB2/TUB3 was used as an internal control for calculating relative levels of CRY2-GFP mRNA in C2G lines and CRY2 mRNA in the wild type. Data were normalized to the level of CRY2 mRNA in vascular bundles of the wild type, which was set to 1 arbitrary unit (a.u.). Mean ± se (n = 3). The lines shown are pCRY-C2G-16, pCAB-C2G-6, pSUC-C2G-2, pSultr-C2G-10, pML-C2G-6, pCER-C2G-8, pUFO-C2G-13, and pAt3g-C2G-7.
Figure 6.
Figure 6.
Quantitative Analysis of the Effects of CRY2-GFP Expression in Vascular Bundles. The flowering times (ordinate) versus the levels of CRY2-GFP mRNA in vascular bundles (abscissa) in pCRY-C2G, pSUC-C2G, and pSultr-C2G lines under LD are shown. Each point represents an individual line. Arrows indicate pCRY-C2G-16, pSUC-C2G-2, and pSultr-C2G-10. The levels of mRNA in vascular bundles were determined by quantitative RT-PCR in 10-d-old seedlings. Relative levels of CRY2-GFP and CRY2 mRNA were calculated as for Figure 5.
Figure 7.
Figure 7.
Diurnal Expression of FT. Seedlings were grown under LD for 9 d, and then RNA was extracted from cotyledons every 3 h over a 24-h period in LD. The samples were analyzed by quantitative RT-PCR. The averages of four biological replicates are shown. TUB2/TUB3 was used as an internal control to calculate relative FT mRNA levels. Relative amounts of FT mRNA in arbitrary units (a.u.) are shown. The peak level of FT mRNA in cotyledons of the wild type was set to 1 arbitrary unit. Mean ± se (n = 4). The lines shown are pCRY-C2G-16, pCAB-C2G-6, and pSUC-C2G-2.
Figure 8.
Figure 8.
FT Expression in Mesophyll and Vascular Bundles. Mesophyll protoplasts (top panel) and vascular bundles (bottom panel) were isolated from cotyledons of 10-d-old seedlings grown under LD. The samples were analyzed by quantitative RT-PCR. The averages of four biological replicates are shown. Relative FT mRNA levels were calculated as for Figure 7. Note that 1 arbitrary unit (a.u.) was defined as the peak level in wild-type cotyledons (Figure 7). Mean ± se (n = 4). The lines shown are pCRY-C2G-16, pCAB-C2G-6, pSUC-C2G-2, pSultr-C2G-10, pML-C2G-6, pCER-C2G-8, pUFO-C2G-13, and pAt3g-C2G-7.

References

    1. An, H., Roussot, C., Suarez-Lopez, P., Corbesier, L., Vincent, C., Pineiro, M., Hepworth, S., Mouradov, A., Justin, S., Turnbull, C., and Coupland, G. (2004). CONSTANS acts in the phloem to regulate a systemic signal that induces photoperiodic flowering of Arabidopsis. Development 131 3615–3626. - PubMed
    1. Bernier, G., Havelange, A., Houssa, C., Petitjean, A., and Lejeune, P. (1993). Physiological signals that induce flowering. Plant Cell 5 1147–1155. - PMC - PubMed
    1. Black, M., and Shuttleworth, J.E. (1974). The role of the cotyledons in the photocontrol of hypocotyl extension in Cucumis sativus L. Planta 117 57–66. - PubMed
    1. Briggs, W.R., and Christie, J.M. (2002). Phototropins 1 and 2: Versatile plant blue-light receptors. Trends Plant Sci. 7 204–210. - PubMed
    1. Casal, J.J., and Smith, H. (1988). Persistent effects of changes in phytochrome status on internode growth in light-grown mustard: Occurrence, kinetics and locus of perception. Planta 175 214–220. - PubMed

Publication types

MeSH terms