. 2007 Jan;19(1):9-22.
doi: 10.1105/tpc.106.048124. Epub 2007 Jan 26.

SDG714, a histone H3K9 methyltransferase, is involved in Tos17 DNA methylation and transposition in rice

Affiliations

SDG714, a histone H3K9 methyltransferase, is involved in Tos17 DNA methylation and transposition in rice

Yong Ding et al. Plant Cell. 2007 Jan.

Abstract

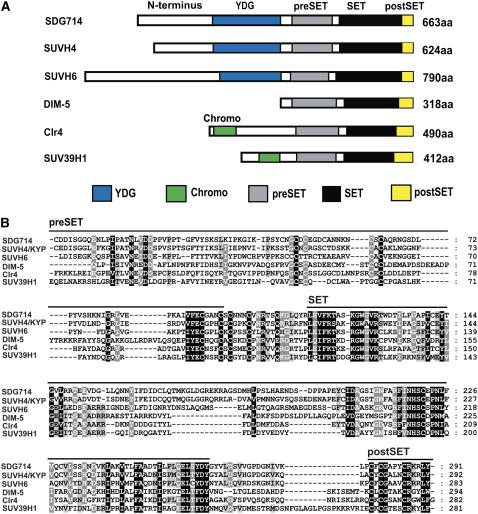
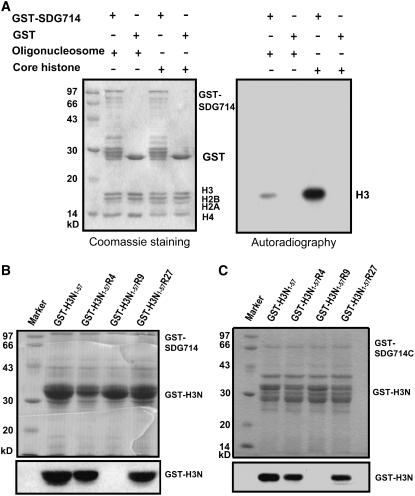
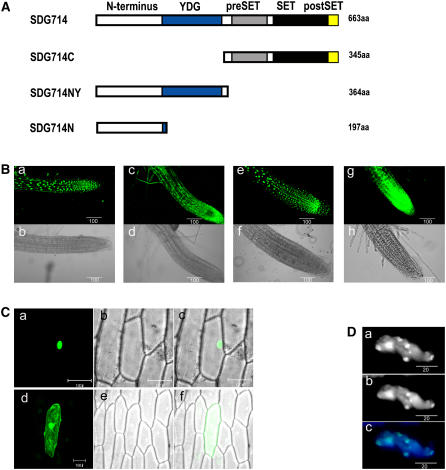
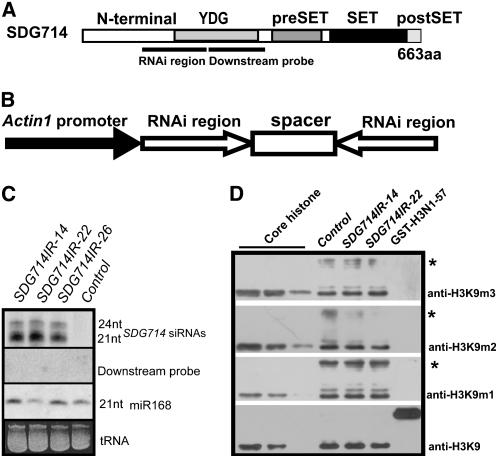
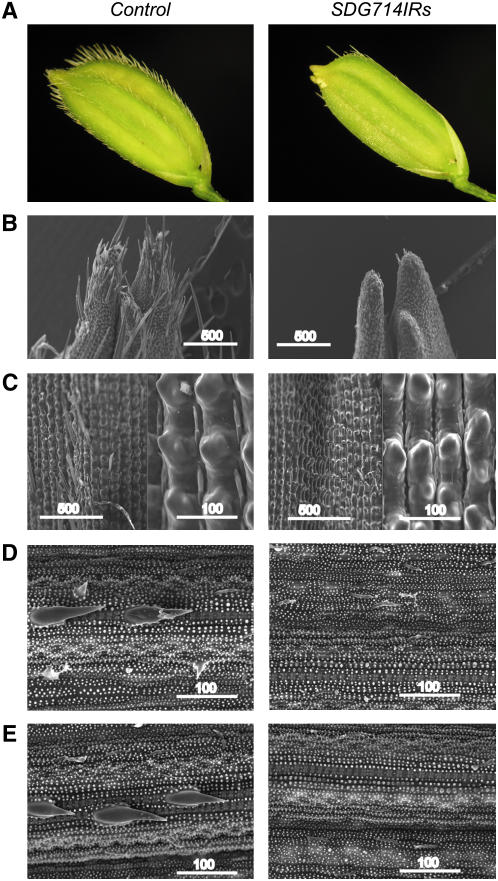
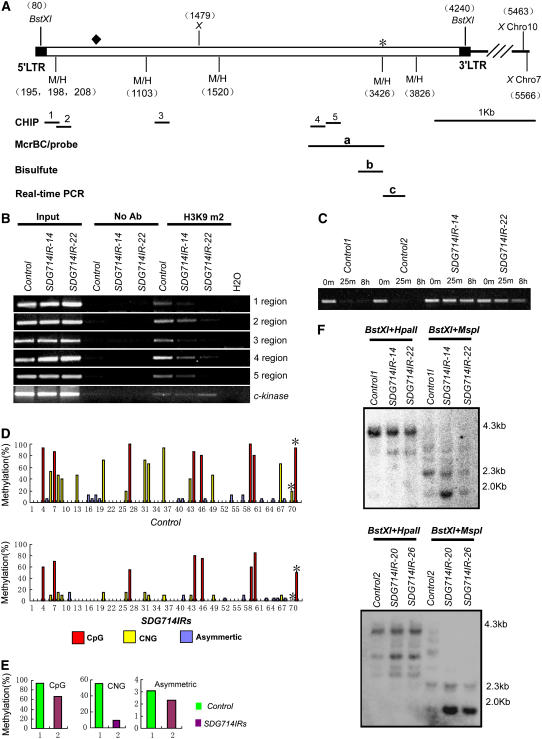
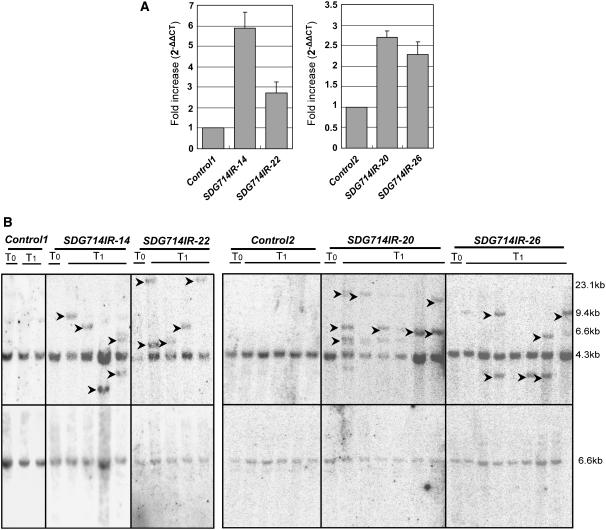
Although the role of H3K9 methylation in rice (Oryza sativa) is unclear, in Arabidopsis thaliana the loss of histone H3K9 methylation by mutation of Kryptonite [also known as SU(VAR)3-9 homolog] reduces genome-wide DNA methylation and increases the transcription of transposable elements. Here, we report that rice SDG714 (for SET Domain Group Protein714) encodes a histone H3K9-specific methyltransferase. The C terminus of SDG714 confers enzymatic activity and substrate specificity, whereas the N terminus localizes it in the nucleus. Loss-of-function mutants of SDG714 (SDG714IR transformants) generated by RNA interference display a mostly glabrous phenotype as a result of the lack of macro trichomes in glumes, leaves, and culms compared with control plants. These mutants also show decreased levels of CpG and CNG cytosine methylation as well as H3K9 methylation at the Tos17 locus, a copia-like retrotransposon widely used for the generation of rice mutants. Most interestingly, loss of function of SDG714 can enhance transcription and cause the transposition of Tos17. Together, these results suggest that histone H3K9 methylation mediated by SDG714 is involved in DNA methylation, the transposition of transposable elements, and genome stability in rice.


Figures

Figure 1.
Figure 1.
Structures of SDG714 and Its Homologous Proteins. (A) Diagram of the domain structures of SDG714, KYP/SUVH4, SUVH6, DIM-5, Clr4, and SUV39H1. Proteins all contain pre-SET (gray boxes), SET (black boxes), and post-SET (yellow boxes) domains. The YDG domain (blue boxes) from SDG714, KYP/SUVH4, and SUVH6 and the chromo domain (green boxes) from Clr4 and SUV39H1 are indicated. aa, amino acids. (B) Alignment of the pre-SET, SET, and post-SET domains of SDG714 with other closely related histone methyltransferases using ClustalW. The amino acid sequence similarities of the catalytic domains from rice SDG714 (372 to 663 amino acids), Arabidopsis thaliana KYP/SUVH4 (332 to 642 amino acids) and SUVH6 (507 to 790 amino acids), Neurospora crassa DIM-5 (64 to 318 amino acids), Schizosaccharomyces pombe Clr4 (208 to 490 amino acids), and Homo sapiens SUV39H1 (131 to 412 amino acids) are shown. The pre-SET, SET, and post-SET domains are indicated by lines.
Figure 2.
Figure 2.
Methyltransferase Activity and Site Specificity of SDG714 in Vitro. (A) Methyltransferase activity of SDG714. GST and GST-SDG714 fusion proteins were tested for their ability to methylate oligonucleosomes or core histones. Enzymes and substrates used are indicated at top. The left panel shows the Coomassie blue–stained gel. The positions of GST and GST-SDG714 fusion proteins and different histones are indicated at right. Autoradiography in the right panel indicates methyltransferase activity and specificity. (B) and (C) Site specificity of SDG714 (B) and the C-terminal part with pre-SET, SET, and post-SET domains of SDG714 (SDG714C; 319 to 663 amino acids) (C). Methyltransferase assays were performed using substrates, as GST-NH3 contains the N-terminal 1 to 57 amino acids of histone H3 fused with GST and point mutations at histone H3K4, H3K9, or H3K27 to Arg (R), named GST-H3N1-57R4, GST-H3N1-57R9, and GST-H3N1-57R27 respectively. Substrates used are indicated at top. The top panels show Coomassie blue–stained gels, and the positions of GST and GST-SDG714C fusion proteins are indicated at right. Autoradiography in the bottom panels indicates methyltransferase activity and specificity.
Figure 3.
Figure 3.
Subcellular Localization of SDG714. (A) Diagram showing the structures of full-length and truncated SDG714 fused to GFP. Full-length SDG714 (1 to 663 amino acids [aa]) contains the N terminus (white), YDG (blue), and the C-terminal catalytic pre-SET (gray), SET (black), and post-SET (yellow) domains, as indicated at top. SDG714C (319 to 613 amino acids) represents the C-terminal catalytic pre-SET, SET, and post-SET domains; SDG714NY (1 to 364 amino acids) represents the N terminus and YDG domain, and SDG714N (1 to 197 amino acids) represents the N terminus only. (B) Nuclear localization of SDG714. Subcellular localization of GFP fusion proteins was observed using 7-d-old Arabidopsis seedlings that stably expressed GFP or GFP fusion proteins. Root tip cells overexpressing GFP-SDG714 (panels a and b), GFP-SDG714C (panels c and d), GFP-SDG714NY (panels e and f), and GFP (panels g and h) were observed by confocal laser scanning microscopy (top panels) and bright-field microscopy (bottom panels). Bars = 100 μm. (C) The N terminus of SDG714 localized in the nucleus. GFP-SDG714N fusion protein (panels a to c) and GFP (panels d to f) were transiently expressed in onion epidermal cells. Green fluorescence was observed by confocal microscopy (panels a and d) and bright-field microscopy (panels b and e). Merged images are shown panels c and f. Bars = 100 μm. (D) SDG714 was associated with heterochromatin. (a) Seven-day-old Arabidopsis roots containing 35S∷GFP-SDG714 show the distribution of SDG714. (b) The same cell was stained with DAPI, showing heterochromatin of the nucleus. (c) A merged image of panels a and b. Bars = 20 μm.
Figure 4.
Figure 4.
SDG714IR Transformants and Protein Gel Blot Analysis. (A) Domain structure of the SDG714 protein. The relative region used in the RNAi knockdown and downstream probe regions are indicated by lines. aa, amino acids. (B) Diagram of SDG714 RNAi constructs. Fragments containing the SDG714 fragment in the sense and antisense orientations separated by an unrelated spacer were cloned under the control of the rice Actin1 promoter. (C) siRNA accumulation in SDG714IR transformants. Results from three independent SDG714IR transformants (SDG714IR-14, SDG714IR-22, and SDG714IR-26) and a control plant transformed with the vector alone (control) are shown. Small RNAs from leaf tissue were probed with the SDG714 inverted repeats region, downstream probe, or oligonucleotides (nt) complementary to microRNA168 (miR168) used as an internal control. tRNA bands visualized by ethidium bromide were used as internal loading controls. (D) Protein blot analysis of in vivo histone H3K9 methylation status. Histone extracts were isolated from a control plant and SDG714IR-14 and SDG714IR-22 transformants. Core histones (8, 6, and 4 μg) from calf thymus and E. coli–expressed GST-H3N1-57 fusion protein were used as positive and negative controls for histone modifications. Histone extracts were calibrated using H3 modification–insensitive antibody (anti-H3K9). Antibodies against monomethylated (anti-H3K9m1), dimethylated (anti-H3K9m2), and trimethylated (anti-H3K9m3) histone H3K9 are shown at right. Asterisks denote possible nonspecific proteins.
Figure 5.
Figure 5.
Macro Trichomes Are Lost in SDG714IR Transformants. (A) Microscopic analysis of seeds from controls (left) and SDG714IR transformants (right). (B) to (E) Scanning electron micrographs show loss of macro trichomes on the apical glumes (B), the middle region of glumes with greater magnification (C), the leaves (D), and the culms (E) in controls (left) and SDG714IR transformants (right). Bars = 500 or 100 μm, as indicated.
Figure 6.
Figure 6.
Decreased Histone H3K9 Methylation and DNA Methylation at Tos17 Loci in SDG714IR Transformants. (A) Structure of Tos17 on chromosome 10 (Chro10) and chromosome 7 (Chro7). 5′ and 3′ long terminal repeat (LTR) regions are indicated with black boxes. Numbers at top and bottom represent relative positions of the indicated restriction sites to the beginning of the 5′ long terminal repeat on chromosome 10 and chromosome 7, respectively. The black diamond indicates a 90-bp deletion on chromosome 7. Restriction maps of Tos17 were labeled. M/H indicates MspI and HpaII restriction enzymes, and X indicates the XbaI restriction enzyme. Different regions for the chromatin immunoprecipitation (CHIP) assay (regions 1 to 5), McrBC-PCR analysis (a), bisulfite sequencing (b), DNA methylation–sensitive DNA gel hybridization probe (a), and real-time PCR analysis (c) are shown. The asterisk represents the HpaII/MspI site, which was also determined by bisulfite sequencing analysis in (D). (B) Chromatin immunoprecipitation analysis of H3K9 dimethylation in SDG714IR transformants (SDG714IR-14 and SDG714IR-22). Chromatin immunoprecipitation assays were performed with antibodies against dimethyl Lys-9 of histone H3 (H3K9m2). Primers specific for regions 1 to 5 of Tos17 are shown in (A). The euchromatin marker C-Kinase was used as an internal control. No Ab, no antibody. (C) McrBC-PCR analysis of DNA methylation at Tos17 loci. Equal amounts of genomic DNAs from two controls (control 1 and control 2) and two SDG714IR transformants (SDG714IR-14 and SDG714IR-22) were digested with McrBC for 0 min, 25 min, and 8 h, followed by PCR amplification of region a shown in (A). (D) Profile of DNA methylation at a 400-bp region (shown in [A]) of Tos17. The numbers on the x axis represent cytosine positions in the analyzed region, and the y axis represents methylation levels in controls (top panel) and SDG714IR transformants (bottom panel). Red, blue, and yellow bars indicate CpG, CNG, and asymmetric methylation, respectively. Asterisks indicate methylation at the CCGG position corresponding to the HpaII/MspI site (3426 bp from the 5′ long terminal repeat on chromosome 10) in control plants and SDG714IR transformants. (E) Histograms represent the percentage of CpG, CNG, and asymmetric methylation in control plants (green) and SDG714IR transformants (purple). (F) DNA gel blot analysis of DNA methylation in SDG714IR transformants. Genomic DNAs of two controls or SDG714IR transformants (SDG714IR-14 and SDG714IR-22 in the top panel, SDG714IR-20 and SDG714IR-26 in the bottom panel) were digested with BstXI, followed by methylation-sensitive enzyme HpaII or MspI, and the blot was hybridized with the probes shown in (A). DNA markers are shown at right.
Figure 7.
Figure 7.
Transcription and Transposition of Tos17 in SDG714IR Transformants. (A) Upregulated transcription of Tos17 in SDG714IR transformants. Tos17 transcription was assessed by real-time PCR (top panel) in two control plants (control 1 and control 2) and four independent SDG714IR transformants (SDG714IR-14, SDG714IR-20, SDG714IR-26, and SDG714IR-22) as indicated. The amplified PCR region of Tos17 corresponds to the c region in Figure 6A. The mean ΔΔCt was converted to a relative value by the equation 2−ΔΔCt. Data are presented as 2−ΔΔCt. The value of 2−ΔΔCt indicates the fold change in gene expression relative to the control. Data represent four independent experiments, and error bars represent sd. (B) Transposition of Tos17 in SDG714IR transformants. Genomic DNA isolated from control plants transformed with the vector alone (control 1 and control 2) or SDG714IR transformants (SDG714IR-14, SDG714IR-22, SDG714IR-20, and SDG714IR-26) from the T0 or T1 generation as indicated at top was digested with the methylation-insensitive enzyme XbaI and sequentially probed with Tos17 (top panel) and Tubulin (bottom panel). Arrowheads indicate the positions of newly transposed Tos17. DNA size markers are shown at right.

References

    1. Alvarez-Venegas, R., Pien, S., Sadder, M., Witmer, X., Grossniklaus, U., and Avramova, Z. (2003). ATX-1, an Arabidopsis homolog of trithorax, activates flower homeotic genes. Curr. Biol. 13 627–637. - PubMed
    1. Bannister, A.J., Zegerman, P., Partridge, J.F., Miska, E.A., Thomas, J.O., Allshire, R.C., and Kouzarides, T. (2001). Selective recognition of methylated lysine 9 on histone H3 by the HP1 chromo domain. Nature 410 120–124. - PubMed
    1. Baumbusch, L.O., Thorstensen, T., Krauss, V., Fischer, A., Naumann, K., Assalkhou, R., Schulz, I., Reuter, G., and Aalen, R.B. (2001). The Arabidopsis thaliana genome contains at least 29 active genes encoding SET domain proteins that can be assigned to four evolutionarily conserved classes. Nucleic Acids Res. 29 4319–4333. - PMC - PubMed
    1. Cao, X., Aufsatz, W., Zilberman, D., Mette, M.F., Huang, M.S., Matzke, M., and Jacobsen, S.E. (2003). Role of the DRM and CMT3 methyltransferases in RNA-directed DNA methylation. Curr. Biol. 13 2212–2217. - PubMed
    1. Cao, X., and Jacobsen, S.E. (2002). Locus-specific control of asymmetric and CpNpG methylation by the DRM and CMT3 methyltransferase genes. Proc. Natl. Acad. Sci. USA 99 (suppl. 4): 16491–16498. - PMC - PubMed

Publication types

MeSH terms

Associated data

LinkOut - more resources