Dwell-time distribution analysis of polyprotein unfolding using force-clamp spectroscopy
- PMID: 17259284
- PMCID: PMC1831696
- DOI: 10.1529/biophysj.106.099481
Dwell-time distribution analysis of polyprotein unfolding using force-clamp spectroscopy
Abstract
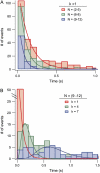
Using the recently developed single molecule force-clamp technique we quantitatively measure the kinetics of conformational changes of polyprotein molecules at a constant force. In response to an applied force of 110 pN, we measure the dwell times of 1647 unfolding events of individual ubiquitin modules within each protein chain. We then establish a rigorous method for analyzing force-clamp data using order statistics. This allows us to test the success of a history-independent, two-state model in describing the kinetics of the unfolding process. We find that the average unfolding trajectory is independent of the number of protein modules N in each trajectory, which varies between 3 and 12 (the engineered protein length), suggesting that the unfolding events in each chain are uncorrelated. We then derive a binomial distribution of dwell times to describe the stochastic dynamics of protein unfolding. This distribution successfully describes 81% of the data with a single rate constant of alpha = 0.6 s(-1) for all N. The remainder of the data that cannot be accounted for suggests alternative unfolding barriers in the energy landscape of the protein. This method investigates the statistical features of unfolding beyond the average measurement of a single rate constant, thus providing an attractive alternative for measuring kinetics by force-clamp spectroscopy.
Figures


Similar articles
-
Reversible mechanical unfolding of single ubiquitin molecules.Biophys J. 2004 Dec;87(6):3995-4006. doi: 10.1529/biophysj.104.042754. Epub 2004 Sep 10. Biophys J. 2004. PMID: 15361414 Free PMC article.
-
Force-clamp spectroscopy of single-protein monomers reveals the individual unfolding and folding pathways of I27 and ubiquitin.Biophys J. 2007 Oct 1;93(7):2436-46. doi: 10.1529/biophysj.107.104422. Epub 2007 Jun 1. Biophys J. 2007. PMID: 17545242 Free PMC article.
-
Analyzing forced unfolding of protein tandems by ordered variates, 2: dependent unfolding times.Biophys J. 2008 Apr 1;94(7):2516-28. doi: 10.1529/biophysj.107.113225. Epub 2007 Dec 7. Biophys J. 2008. PMID: 18065466 Free PMC article.
-
Determination of thermodynamics and kinetics of RNA reactions by force.Q Rev Biophys. 2006 Nov;39(4):325-60. doi: 10.1017/S0033583506004446. Epub 2006 Oct 16. Q Rev Biophys. 2006. PMID: 17040613 Free PMC article. Review.
-
Force as a useful variable in reactions: unfolding RNA.Annu Rev Biophys Biomol Struct. 2004;33:363-85. doi: 10.1146/annurev.biophys.33.110502.140418. Annu Rev Biophys Biomol Struct. 2004. PMID: 15139818 Free PMC article. Review.
Cited by
-
Force-clamp analysis techniques give highest rank to stretched exponential unfolding kinetics in ubiquitin.Biophys J. 2012 Nov 21;103(10):2215-22. doi: 10.1016/j.bpj.2012.10.022. Epub 2012 Nov 20. Biophys J. 2012. PMID: 23200055 Free PMC article.
-
Emergence of slip-ideal-slip behavior in tip-links serve as force filters of sound in hearing.Nat Commun. 2024 Feb 21;15(1):1595. doi: 10.1038/s41467-024-45423-8. Nat Commun. 2024. PMID: 38383683 Free PMC article.
-
Increasing the accuracy of single-molecule data analysis using tMAVEN.bioRxiv [Preprint]. 2024 Jan 21:2023.08.15.553409. doi: 10.1101/2023.08.15.553409. bioRxiv. 2024. Update in: Biophys J. 2024 Sep 3;123(17):2765-2780. doi: 10.1016/j.bpj.2024.01.022. PMID: 37645812 Free PMC article. Updated. Preprint.
-
Domain-domain interactions in filamin A (16-23) impose a hierarchy of unfolding forces.Biophys J. 2013 May 7;104(9):2022-30. doi: 10.1016/j.bpj.2013.03.034. Biophys J. 2013. PMID: 23663845 Free PMC article.
-
Nanomechanics of HaloTag tethers.J Am Chem Soc. 2013 Aug 28;135(34):12762-71. doi: 10.1021/ja4056382. Epub 2013 Aug 19. J Am Chem Soc. 2013. PMID: 23909704 Free PMC article.
References
-
- Johnston, D., and S. M. Wu. 1995. Foundations of Cellular Neurophysiology. MIT Press, Cambridge, MA.
-
- Colquhoun, D., and B. Sakmann. 1981. Fluctuations in the microsecond time range of the current through single acetylcholine receptor ion channels. Nature. 294:464–466. - PubMed
-
- Hille, B. 1992. Ionic Channels of Excitable Membranes. Sinaurer Associates, Sunderland, MA.
-
- Bekkers, J. M., and C. F. Stevens. 1990. Presynaptic mechanism for long-term potentiation in the hippocampus. Nature. 346:724–729. - PubMed
-
- Yang, H., G. Luo, P. Karnchanaphanurach, T. M. Louie, I. Rech, S. Cova, L. Xun, and X. S. Xie. 2003. Protein conformational dynamics probed by single-molecule electron transfer. Science. 302:262–266. - PubMed
Publication types
MeSH terms
Substances
Grants and funding
LinkOut - more resources
Full Text Sources
Other Literature Sources

