. 2007 Mar;143(3):1306-13.
doi: 10.1104/pp.106.093005. Epub 2007 Jan 26.

Spatial distribution and temporal variation of the rice silicon transporter Lsi1

Affiliations

Spatial distribution and temporal variation of the rice silicon transporter Lsi1

Naoki Yamaji et al. Plant Physiol. 2007 Mar.

Abstract

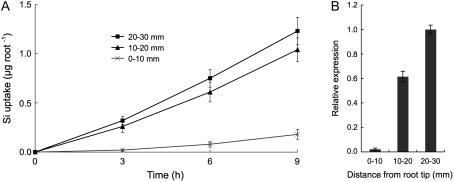
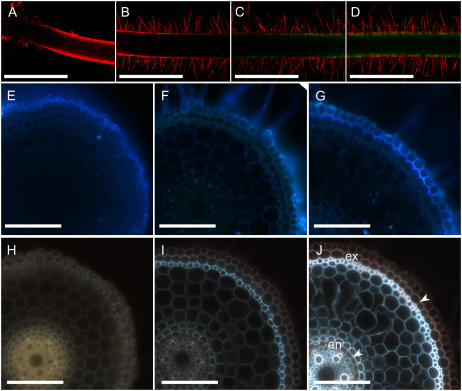
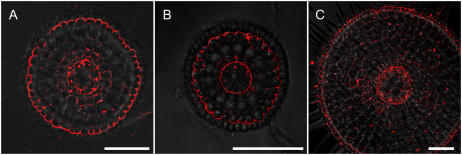
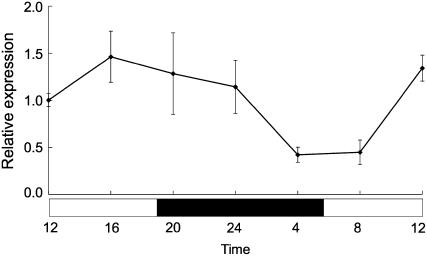
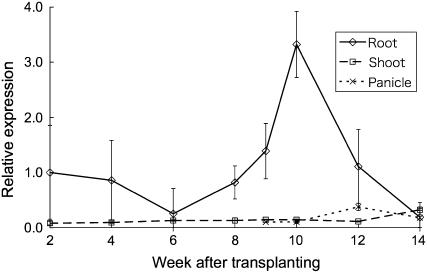
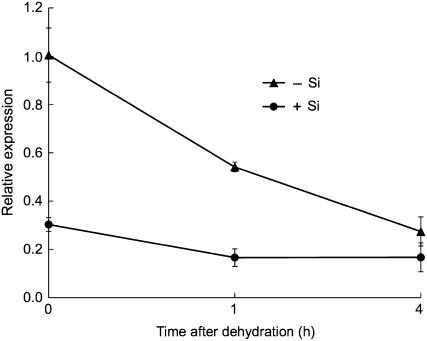
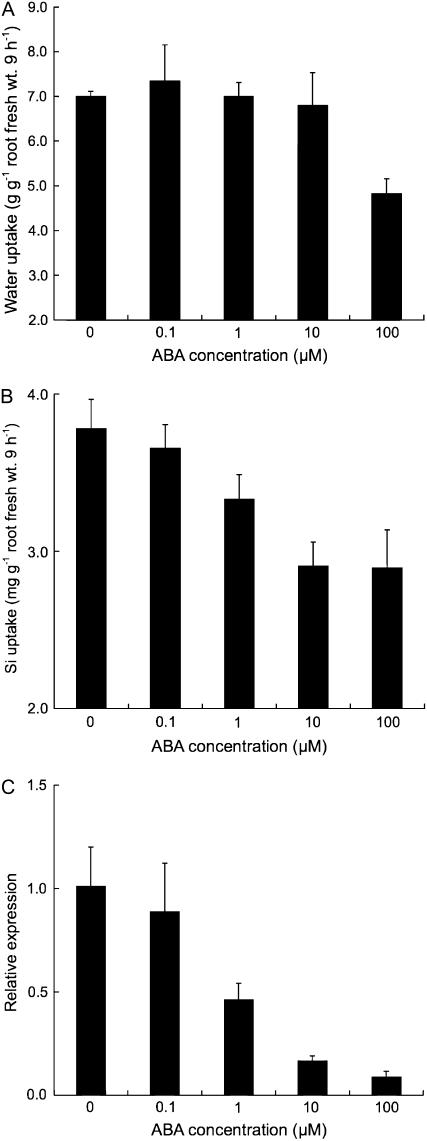
Rice (Oryza sativa) is a typical silicon (Si) accumulator and requires a large amount of Si for high-yield production. Recently, a gene (Low silicon rice1 [Lsi1]) encoding a Si transporter was identified in rice roots. Here, we characterized Lsi1 in terms of spatial distribution and temporal variation using both physiological and molecular approaches. Results from a multicompartment transport box experiment showed that the major site for Si uptake was located at the basal zone (>10 mm from the root tip) of the roots rather than at the root tips (<10 mm from the root tip). Consistent with the Si uptake pattern, Lsi1 expression and distribution of the Lsi1 protein were found only in the basal zone of roots. In the basal zones of the seminal, crown, and lateral roots, the Lsi1 protein showed a polar localization at the distal side of both the exodermis and endodermis, where the Casparian bands are formed. This indicates that Lsi1 is required for the transport of Si through the cells of the exodermis and endodermis. Expression of Lsi1 displayed a distinct diurnal pattern. Furthermore, expression was transiently enhanced around the heading stage, which coincides with a high Si requirement during this growth stage. Expression was down-regulated by dehydration stress and abscisic acid, suggesting that expression of Lsi1 may be regulated by abscisic acid.


Figures

Figure 1.
Figure 1.
Regional difference of Si uptake and Lsi1 expression in rice seminal roots. A, Multicompartment transport box experiment. Excised seminal roots were placed in a box consisting of four compartments. One of the three compartments, first (0–10 mm from the root tip), second (10–20 mm), or third (20–30 mm), was exposed to a Si-containing solution individually. Si concentration in the fourth compartment (containing the cut ends) was determined at the times indicated. B, Relative Lsi1 transcript levels at each segment were measured by real-time RT-PCR. Data are means ± sd (n = 3).
Figure 2.
Figure 2.
Distribution of Lsi1 transporter and development of apoplastic barrier in rice. A to D, Confocal laser-scanning images of root apex (A) and 10 mm (B), 15 mm (C), 30 mm (D) from tip of intact seminal root of Lsi1GFP transgenic rice counterstained with propidium iodide. E to G, Cross section at 3 mm (E), 10 mm (F), and 30 mm (G) from the apex of a seminal root prestained with the apoplastic transport dye, Fluostain I, for 2 h. H to J, Cross section at 3 mm (H), 10 mm (I), 30 mm (J) from the apex of a seminal root stained with Fluorol yellow 088 to visualize the suberin lamella (arrowheads). The exodermis (ex) and endodermis (en) are shown. Scale bars = 1 mm (A–D) and 100 μm (E–J).
Figure 3.
Figure 3.
Cellular localization of Lsi1 in different types of rice roots. Roots were stained with anti-Lsi1 polyclonal antibody. A, Seminal root. B, Lateral root. C, Crown root. Scale bar = 100 μm.
Figure 4.
Figure 4.
Diurnal variation of Lsi1 expression in rice roots. Roots were sampled every 4 h. Lsi1 expression level in the root was measured by real-time RT-PCR. White and black columns indicate the light and dark period, respectively. Data are means ± sd (n = 3).
Figure 5.
Figure 5.
Developmental variation of Lsi1 expression in different tissues of rice. Rice plants grown in a field were sampled every 2 weeks and at heading (at 9 weeks after transplanting). Lsi1 expression level in the root, shoot, and panicle was measured by real-time RT-PCR. Data are means ± sd (n = 3).
Figure 6.
Figure 6.
Effect of dehydration on Lsi1 expression in rice roots. Rice seedlings precultured with or without 1 mm Si for 3 d was used. Dehydration was induced by removal of the nutrient solution. Lsi1 expression level in the root was measured by real-time RT-PCR. Data are means ± sd (n = 3).
Figure 7.
Figure 7.
Effect of ABA on Lsi1 expression and Si and water uptake in rice. The uptake experiment was conducted in a nutrient solution containing 1 mm Si in the presence of various concentrations of ABA. Water uptake (A), Si uptake (B), and Lsi1 expression (C) were measured at 9 h. Data are means ± sd (n = 3).

References

    1. Alexandersson E, Fraysse L, Sjövall-Larsen S, Gustavsson S, Fellert M, Karlsson M, Johanson U, Kjellbom P (2005) Whole gene family expression and drought stress regulation of aquaporins. Plant Mol Biol 59 469–484 - PubMed
    1. Ashley MK, Grant M, Grabov A (2006) Plant responses to potassium deficiencies: a role for potassium transport proteins. J Exp Bot 57 425–436 - PubMed
    1. Brundrett MC, Kendrick B, Peterson CA (1991) Efficient lipid staining in plant material with sudan red 7B or fluorol yellow 088 in polyethylene glycol-glycerol. Biotech Histochem 66 111–116 - PubMed
    1. Buchner P, Takahashi H, Hawkesford MJ (2004) Plant sulphate transporters: co-ordination of uptake, intracellular and long-distance transport. J Exp Bot 55 1765–1773 - PubMed
    1. Casey WH, Kinrade SD, Knight CTG, Rains DW, Epstein E (2003) Aqueous silicate complexes in wheat, Triticum aestivum L. Plant Cell Environ 27 51–54

Publication types

Associated data

LinkOut - more resources