. 2007 Feb;56(2):285-94.
doi: 10.2337/db06-0436.

IGF-binding protein-2 protects against the development of obesity and insulin resistance

Affiliations

IGF-binding protein-2 protects against the development of obesity and insulin resistance

Stephen B Wheatcroft et al. Diabetes. 2007 Feb.

Abstract

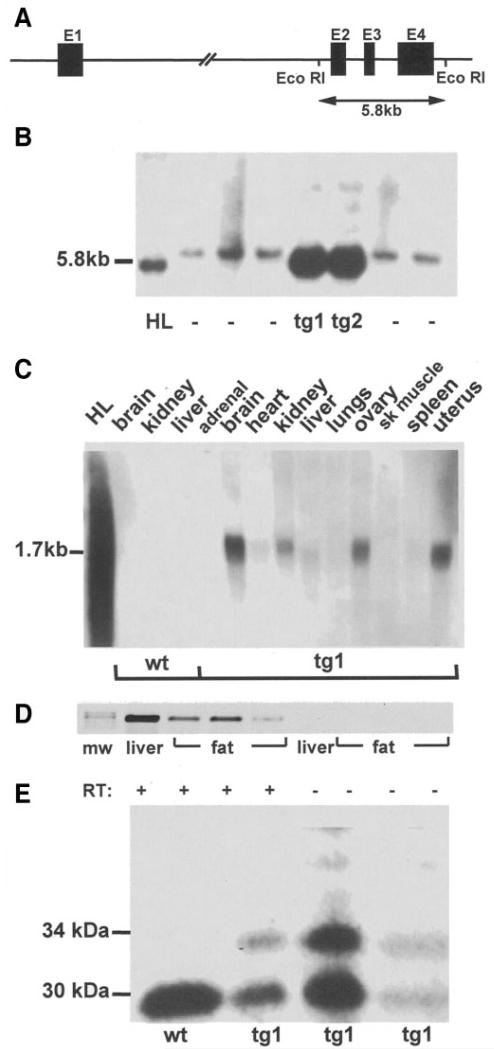
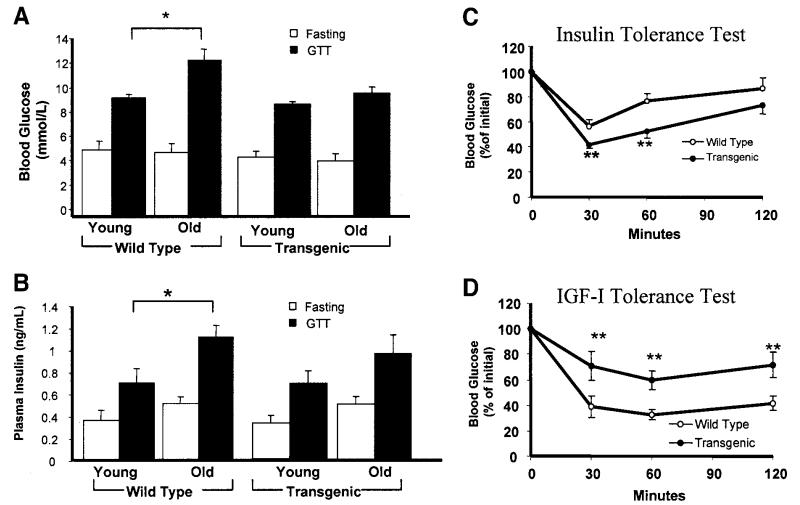
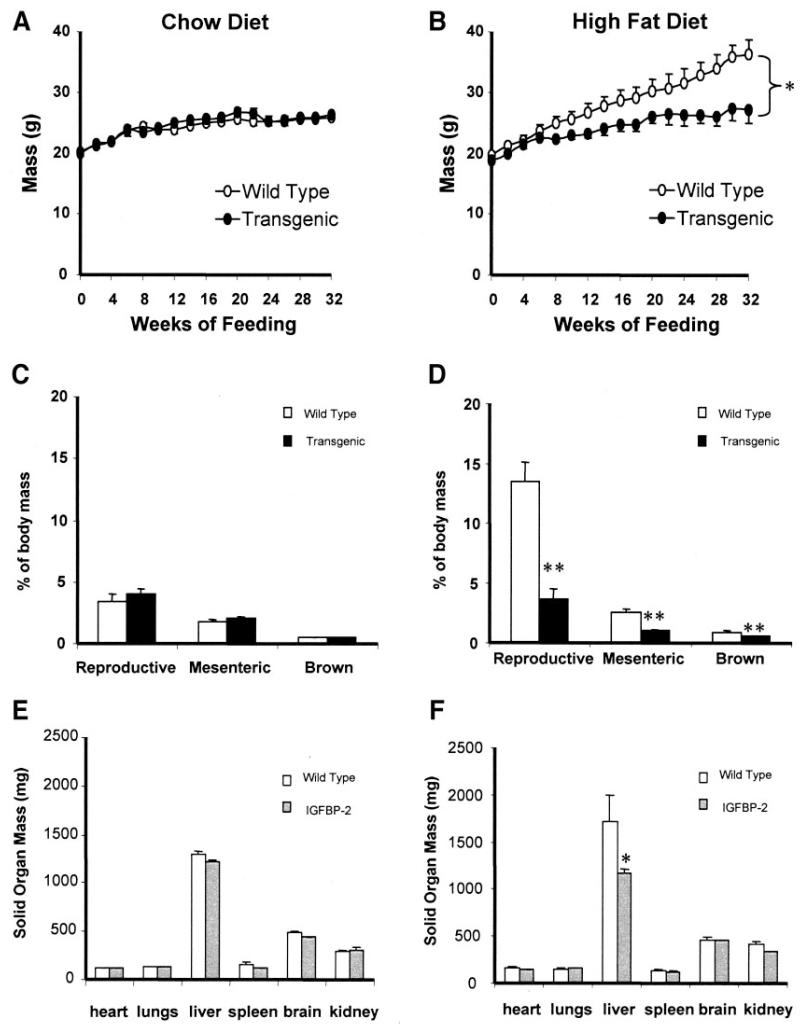
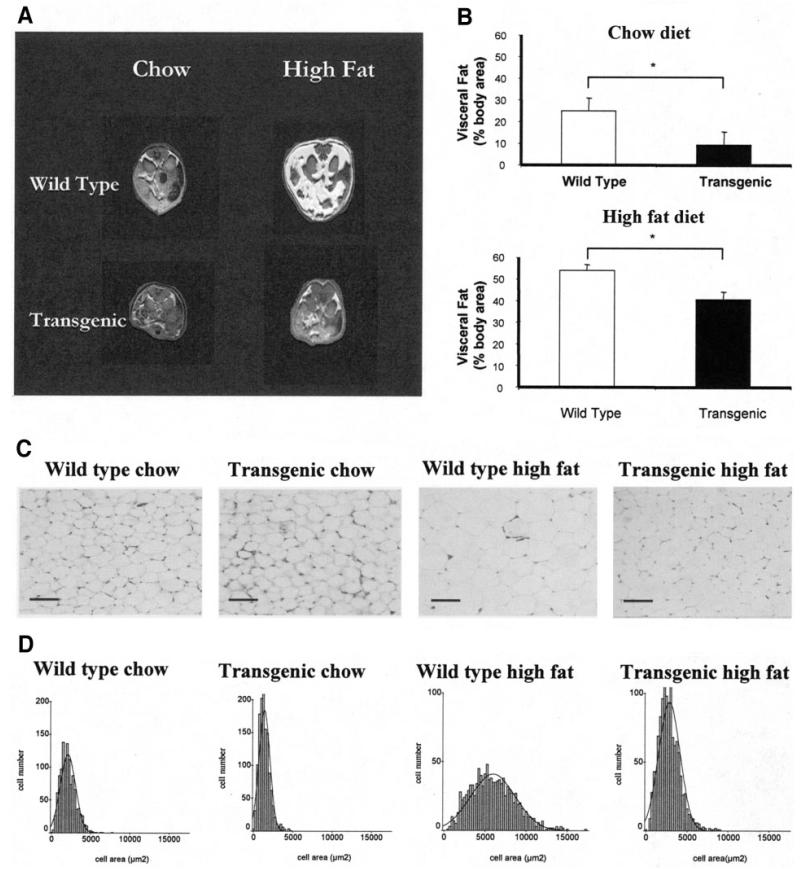
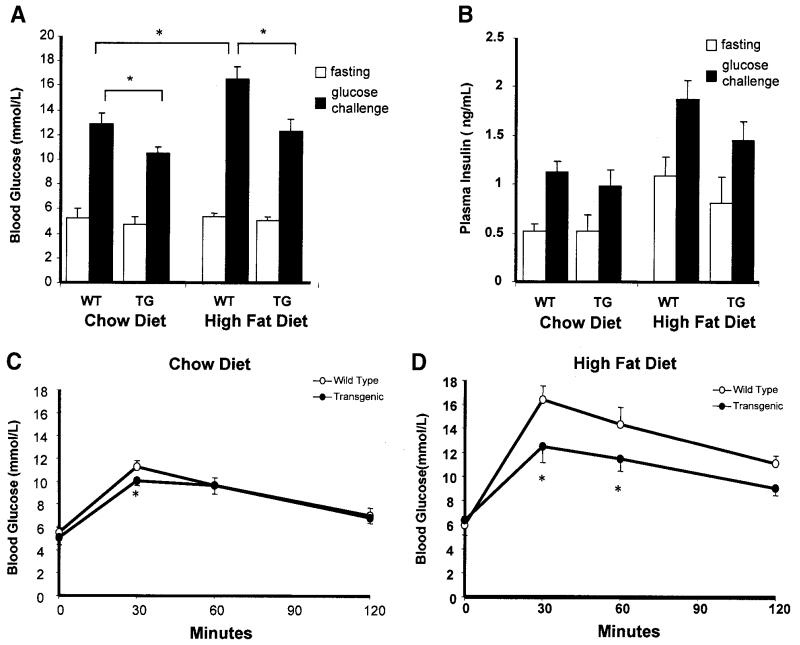
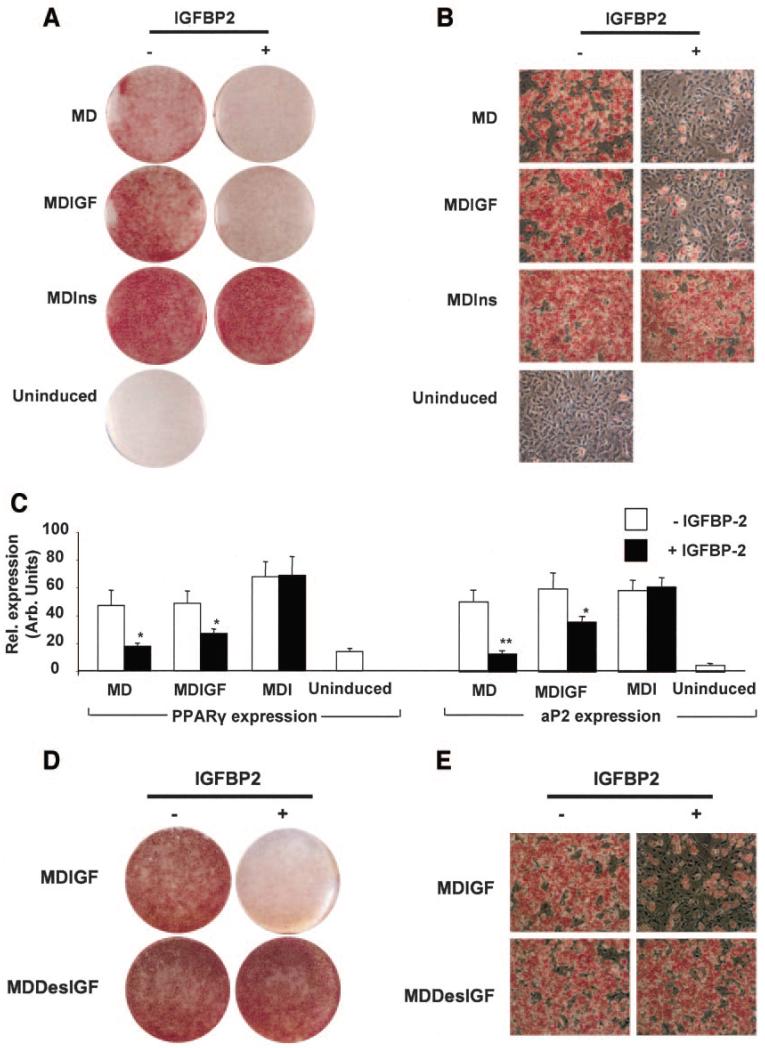
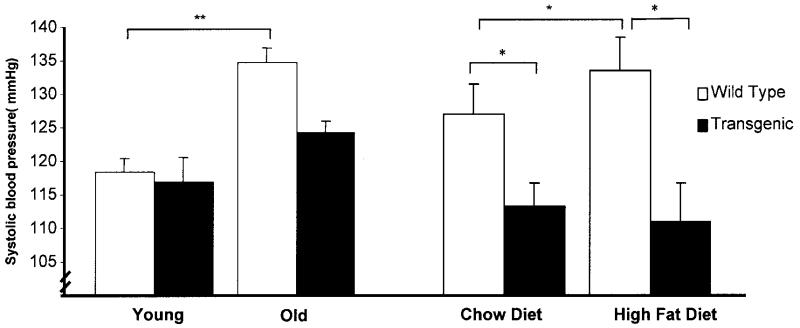
Proliferation of adipocyte precursors and their differentiation into mature adipocytes contributes to the development of obesity in mammals. IGF-I is a potent mitogen and important stimulus for adipocyte differentiation. The biological actions of IGFs are closely regulated by a family of IGF-binding proteins (IGFBPs), which exert predominantly inhibitory effects. IGFBP-2 is the principal binding protein secreted by differentiating white preadipocytes, suggesting a potential role in the development of obesity. We have generated transgenic mice overexpressing human IGFBP-2 under the control of its native promoter, and we show that overexpression of IGFBP-2 is associated with reduced susceptibility to obesity and improved insulin sensitivity. Whereas wild-type littermates developed glucose intolerance and increased blood pressure with aging, mice overexpressing IGFBP-2 were protected. Furthermore, when fed a high-fat/high-energy diet, IGFBP-2-overexpressing mice were resistant to the development of obesity and insulin resistance. This lean phenotype was associated with decreased leptin levels, increased glucose sensitivity, and lower blood pressure compared with wild-type animals consuming similar amounts of high-fat diet. Our in vitro data suggest a direct effect of IGFBP-2 preventing adipogenesis as indicated by the ability of recombinant IGFBP-2 to impair 3T3-L1 differentiation. These findings suggest an important, novel role for IGFBP-2 in obesity prevention.


Figures

FIG. 1
FIG. 1
Generation of transgenic mice overexpressing IGFBP-2. A: Schematic diagram of the IGFBP-2 cosmid clone chBP2:4. Exons (1-4) are represented by solid bars, and the positions of EcoR1 sites are indicated. B: Southern blot analysis of EcoR1-digested DNA from two lines of founder mice (tg1 and tg2) showing the characteristic 5.8-kb bands from the human IGFBP-2 gene. Other lanes contain DNA from nontransgenic mice (−) or human liver (HL) C: Northern analysis of tissues from wild-type (wt) and transgenic (tg1) mice probed with human IGFBP-2 cDNA. HL, RNA from human liver. D: RT-PCR demonstrating human IGFBP-2 mRNA expression in reproductive fat depots from three representative transgenic mice (mw, molecular weight marker). Liver RNA was used as a positive control. RNA samples with the reverse transcription step omitted (RT−) were used as negative controls. E: Representative Western ligand blot of fasting sera from wt and tg1 mice. Human IGFBP-2 (34 kDa) and murine IGFBP-2 (30 kDa) are indicated (human IGFBP-2 has 18 amino acids more than the murine protein). Analysis of mean data revealed that IGFBP-2 abundance in transgenic mice was 2.2-fold greater than wild-type mice by densitometry (P < 0.05, n = 12 per group).
FIG. 2
FIG. 2
Age-related changes in metabolic homeostasis in wild-type and IGFBP-2 transgenic mice. A and B: Blood glucose and plasma insulin concentrations were measured after an overnight fast and 30 min after a glucose challenge (1 mg/g i.p.) in mice 8 weeks (young) and 40 weeks (old) of age. C and D: Insulin and IGF-I tolerance tests were carried out in 40-week-old mice; blood glucose levels were measured at intervals after the intraperitoneal injection of insulin (0.5 IU/kg) or IGF-I (0.2 μg/g). *P < 0.05, **P < 0.01, n = 8–12 per group.
FIG. 3
FIG. 3
Body mass and organ mass in response to high-fat feeding in wild-type and IGFBP-2 transgenic mice. A and B: Body mass was assessed in response to feeding standard chow or a high-fat diet for 32 weeks. C and D: Adipose tissue depot mass was measured postmortem after 32 weeks of feeding. E and F: Solid organ mass was measured postmortem after 32 weeks of feeding. *P < 0.05, **P < 0.01, n = 8–12 per group.
FIG. 4
FIG. 4
Changes in adiposity in response to high-fat feeding in wild-type and IGFBP-2 transgenic mice. A and B: Visceral fat was assessed by MRI in mice receiving chow or high-fat diet for 32 weeks (n = 3). C: Representative sections of perigonadal fat after 32 weeks of feeding (initial magnification ×10; bar = 50 μm). D: Adipocyte area in histological sections of perigonadal fat after 32 weeks of feeding. *P < 0.05, n = 6 per group.
FIG. 5
FIG. 5
Changes in glucoregulation in response to high-fat feeding in wild-type (WT) and IGFBP-2 transgenic (TG) mice. A and B: Blood glucose and plasma insulin concentrations were measured after an overnight fast and 30 min after a glucose challenge in wild-type and transgenic mice receiving chow or high-fat diet for 32 weeks. C and D: Insulin-tolerance test. Blood glucose levels were measured at intervals after the intraperitoneal injection of insulin (0.5 IU/kg) after 32 weeks of feeding. *P < 0.05, n = 8-12.
FIG. 6
FIG. 6
IGFBP-2 impairs differentiation of 3T3-L1 preadipocytes. 3T3-L1 preadipocytes were induced for 2 days with either differentiation medium alone (uninduced) or differentiation medium containing either isobutylmethylxanthine (IBMX) and dexamethasone (MD); or IBMX, dexamethasone, and insulin (MDI); or IBMX, dexamethasone, and hIGF-I (MDIGF). The subsequent 2-day treatment involved the same induction cocktails minus IBMX and dexamethasone. IGFBP-2 treatment was maintained for the first 4 days of differentiation. Differentiation was terminated on day 8 after induction. A and B: Macroscopic and microscopic views of oil red O–stained monolayers, respectively. C: Gene expression levels of PPARγ and aP2, respectively, after normalization with 18S levels. D and E: Macroscopic and microscopic views of oil red O–stained 3T3-L1 preadipocytes induced with IBMX, dexamethasone, and either hIGF-I (MDIGF) or hDes (1–3)IGF-I (MDDesIGF). Data represent means ± SE of at least three independent experiments. Two-tailed, two sample, equal variance Student’s t test were used to assess statistical significance. *P < 0.05, **P < 0.01.
FIG. 7
FIG. 7
Systolic blood pressure measured by tail-cuff plethysmography in conscious, restrained animals at 8 weeks of age (young), 40 weeks of age (old), and after feeding a chow diet or high-fat diet for 32 weeks. *P < 0.05, **P < 0.001, n = 8–12 per group.

References

    1. Flegal KM, Carroll MD, Ogden CL, Johnson CL. Prevalence and trends in obesity among US adults, 1999-2000. JAMA. 2002;288:1723–1727. - PubMed
    1. Fontaine KR, Redden DT, Wang C, Westfall AO, Allison DB. Years of life lost due to obesity. JAMA. 2003;289:187–193. - PubMed
    1. Gregoire FM, Smas CM, Sul HS. Understanding adipocyte differentiation. Physiol Rev. 1998;78:783–809. - PubMed
    1. Hausman DB, DiGirolamo M, Bartness TJ, Hausman GJ, Martin RJ. The biology of white adipocyte proliferation. Obes Rev. 2001;2:239–254. - PubMed
    1. Schmidt W, Poll-Jordan G, Loffler G. Adipose conversion of 3T3-L1 cells in a serum-free culture system depends on epidermal growth factor, insulin-like growth factor I, corticosterone, and cyclic AMP. J Biol Chem. 1990;265:15489–15495. - PubMed

Publication types

MeSH terms

Substances