. 2007 Mar 1;79(5):1897-906.
doi: 10.1021/ac061975q. Epub 2007 Jan 30.

Electrochemiluminescent arrays for cytochrome P450-activated genotoxicity screening. DNA damage from benzo[a]pyrene metabolites

Affiliations

Electrochemiluminescent arrays for cytochrome P450-activated genotoxicity screening. DNA damage from benzo[a]pyrene metabolites

Eli G Hvastkovs et al. Anal Chem. .

Erratum in

  • Anal Chem. 2008 Mar 15;80(6):2272

Abstract

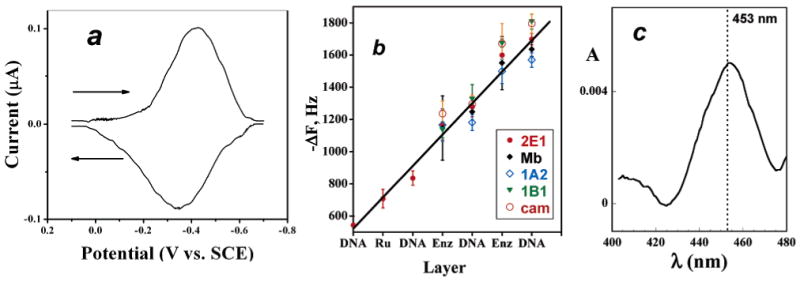
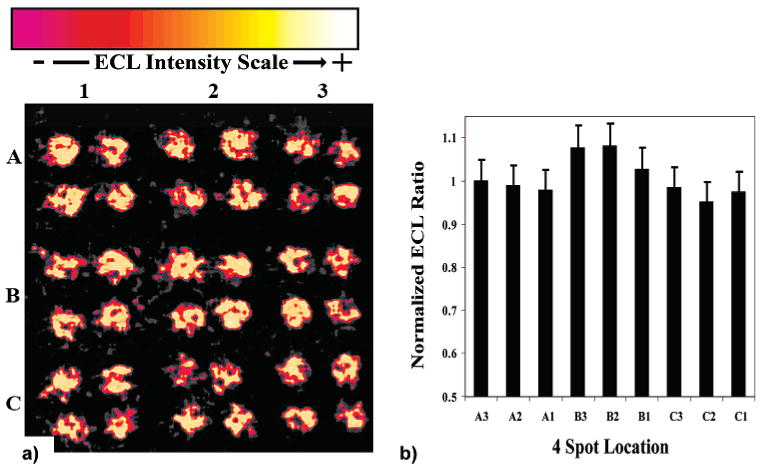
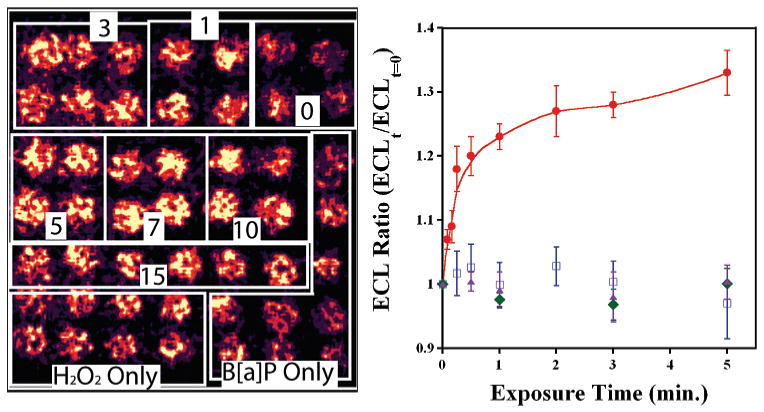
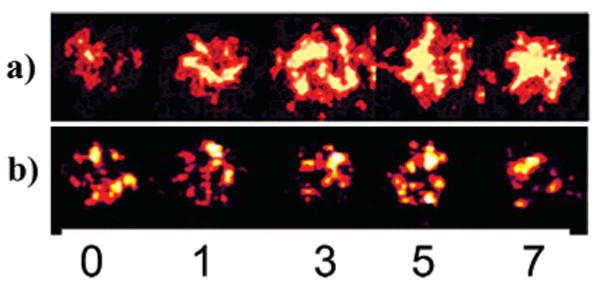
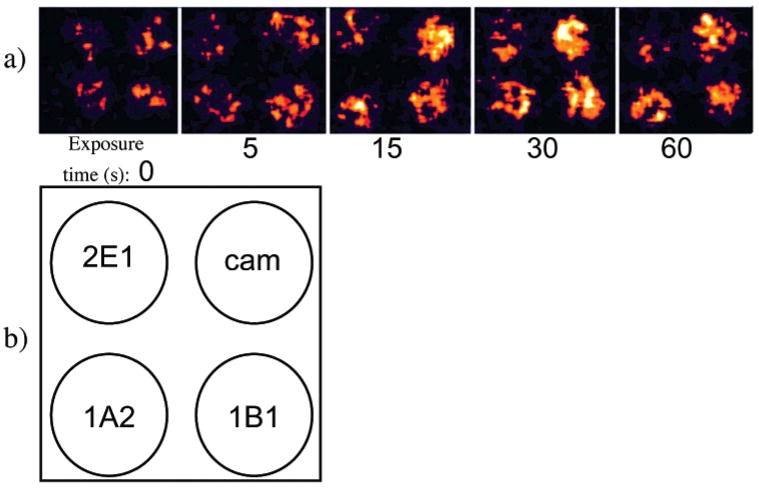
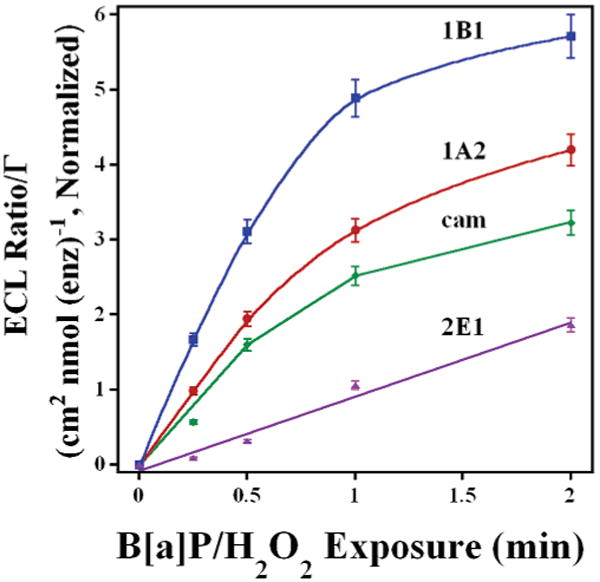
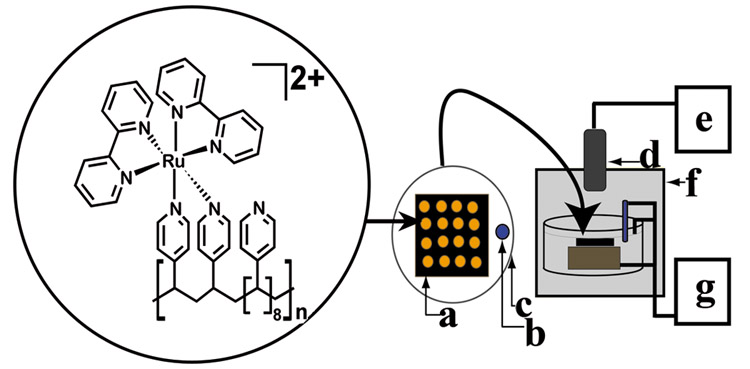
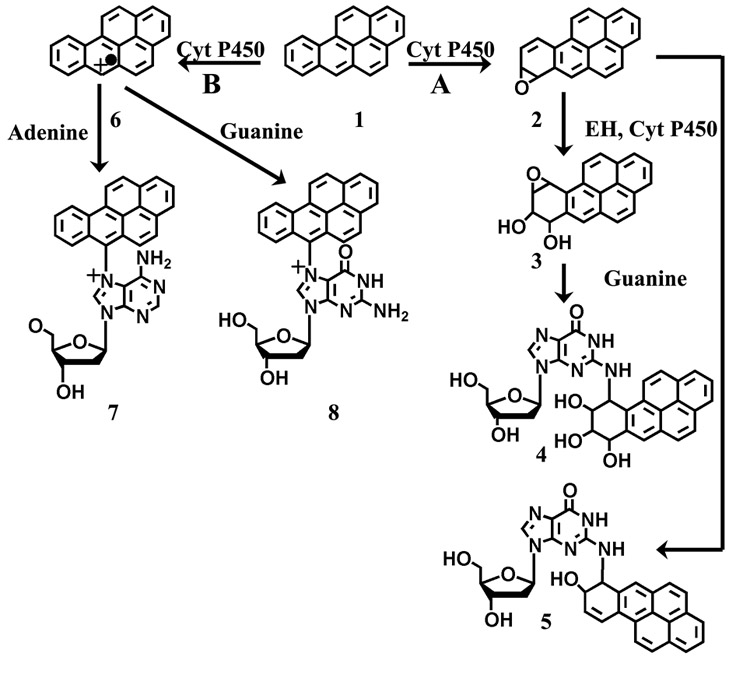
Arrays suitable for genotoxicity screening are reported that generate metabolites from cytochrome P450 enzymes (CYPs) in thin-film spots. Array spots containing DNA, various human cyt P450s, and electrochemiluminescence (ECL) generating metallopolymer [Ru(bpy)2PVP10]2+ were exposed to H2O2 to activate the enzymes. ECL from all spots was visualized simultaneously using a CCD camera. Using benzo[a]pyrene as a test substrate, enzyme activity for producing DNA damage in the arrays was found in the order CYP1B1 > CYP1A2 > CYP1A1 > CYP2E1 > myoglobin, the same as the order of their metabolic activity. Thus, these arrays estimate the relative propensity of different enzymes to produce genotoxic metabolites. This is the first demonstration of ECL arrays for high-throughput in vitro genotoxicity screening.


Figures

Figure 1
Figure 1
Characterization data for films: (a) Background-subtracted, smoothed reversible CV of cyt P450 1B1 on PG electrode at 50 mV/s in pH 7.1 phosphate buffer + 50 mM NaCl. Film composition on electrode was PDDA/DNA/cyt P450 1B1/DNA. (b) Influence of film layers added on QCM frequency decrease for enzymes used in this study. The first three film layers are omitted (RuPVP/DNA/RuPVP) for clarity. (c) Visible difference spectrum for immobilized PDDA/cyt P450cam film on glass microscope slide after reduction to the ferrous form and addition of CO showing the characteristic cyt P450 FeII-CO band near 450 nm.
Figure 2
Figure 2
(a) A 36-spot ECL array not exposed to procarcinogenic material showing the spot-to-spot consistency generated from each location on the PG block. Conditions: 10 mM sodium acetate, 0.15 M NaCl, pH 5.5, +1.25 V; 20 s. (b) A column chart showing the relative ECL intensity to spot A3 (upper right corner) from each 4-unit spot location on the PG block.
Figure 3
Figure 3
(a) CCD image of ECL array with 49 individual RuPVP/DNA/enzyme spots containing cyt P450 1B1. Boxes denote spots that were exposed to 0.5 mM H2O2 + 100 μM B[a]P for the labeled times (min). Controls on bottom were exposed to B[a]P or H2O2 only for increasing amounts of time from 1 to 7 min as viewed from right to left (not marked for clarity). (b) ECL ratio plot demonstrating the increase in ECL intensity vs time of enzyme reaction. Controls show ECL response vs time exposed to B[a]P only (blue squares), H2O2 only (green diamonds), and 0.5 mM H2O2 + 100 μM B[a]P + 30 μM of inhibitor αNF (purple triangles).
Figure 4
Figure 4
Comparison of ECL response of RuPVP/DNA/enzyme spots containing cyt P450 1B1 after denoted exposure time (min) to 0.5 mM H2O2 + 100 μM B[a]P (a) without and (b) with the addition of 30 μM inhibitor αNF.
Figure 5
Figure 5
(a) Reconstructed array image where multiple cyt P450 enzymes were present in the Ru/PVP films on a single PG array and exposed to 0.5 mM H2O2 + 100 μM B[a]P for increasing times (s). (b) Schematic showing the location of cyt P450 enzymes in each 4-spot image in Figure 7a.
Figure 6
Figure 6
Influence of B[a]P/H2O2 exposure time for cyt P450 enzymes located on same array. ECL ratio was normalized for amount of enzyme. Cyt P450s used were 1B1(blue), 1A2 (red), cam (green), and 2E1 (purple).
Figure 7
Figure 7
(a) CapLC chromatogram showing elution of reaction media after 10-min exposure of Mb immobilized in a thin film on SiO2 microspheres to B[a]P/H2O2 (red). Controls are B[a]P only (blue) and 100 mM B[a]P reacted with 0.5 mM H2O2 for 10 min in the absence of Mb (green). (b) MS for the 11–12-min eluting peaks in (a) along with representative epoxides and diol forms of B[a]P. (c) CapLC chromatogram (select ion mode) measuring total ion current m/z 402 from neutral hydrolysate of DNA/Mb film immobilized on carbon cloth after 10-min exposure to 100 mM B[a]P + 0.5 mM H2O2. (d) MS/MS of the 17-min elution peak in (c) with expected fragmentation pattern of parent B[a]P–guanine ion.
Scheme 1
Scheme 1. Conceptual Diagram of the ECL Array Instrumentationa
a RuPVP polymer, DNA, and enzymes are located in each spot on a (a) pyrolytic graphite block; with (b) Ag/AgCl reference electrode, (c) Pt wire counter electrode, (d) CCD camera, (e) computer, (f) gel-doc dark room, and (g) potentiostat for applied voltage control.
Scheme 3
Scheme 3. Summary of Possible Metabolic Routes for B[a]P in Vivoa
a Pathway A shows the formation of possible proximal epoxides (1) by cyt P450 followed by direct nucleophilic attack to form guanine adducts at the N2 position (2) or hydrolysis by epoxide hydrolase to form a diol product, and a second cyt P450-mediated epoxidation forming diol epoxides (3), and the final nucleophilic attack forming a guanine adduct at the N2 position (4). Pathway B shows the one-electron oxidation by cyt P450 to form the reactive cation radical (5) with subsequent nucleophilic attack on guanine (6) or adenine (7) forming adducts at the N7 position on the nucleobases.

Similar articles

Cited by

References

    1. Schenkman JB, Greim H, editors. Cytochrome P450. Springer-Verlag; Berlin: 1993.
    1. Ortiz de Montellano PR, editor. Cytochrome P450. Kluwer/Plenum; New York: 2005.
    1. Guengerich FP. Asia Pac J Pharmacol. 1990;5:327–345.
    2. Gonzalez FJ. Trends Pharm Sci. 1992;13:346–352. - PubMed
    3. Guengerich FP. Toxicol Lett. 1994;70:133–138. - PubMed
    4. Guengerich FP. Chem Res Toxicol. 2001;14:611–650. - PubMed
    5. Guengerich FP, Parikh A, Turesky RJ, Josephry PD. Mutat Res. 1999;428:115–124. - PubMed
    6. Guengerich FP. Chem Res Toxicol. 2001;14:611–650. - PubMed
    1. Cadet J, Weinfeld M. Anal Chem. 1993;65:675A–682A. - PubMed
    2. Koc H, Swenberg JA. J Chromatogr B. 2002;778:323–343. - PubMed
    3. Farmer PB, Brown K, Tompkins E, Emms VL, Jones DJL, Singh R, Phillips DH. Toxicol Appl Pharmacol. 2005;207:S293–S301. - PubMed
    1. Tarun M, Rusling JF. Crit Rev Eukaryotic Gene Expression. 2005;15:295–315. - PubMed

Publication types