Comparative Study
. 2007 Feb 19;204(2):331-43.
doi: 10.1084/jem.20061442. Epub 2007 Jan 29.

Hierarchy of Notch-Delta interactions promoting T cell lineage commitment and maturation

Affiliations
Comparative Study

Hierarchy of Notch-Delta interactions promoting T cell lineage commitment and maturation

Valerie Besseyrias et al. J Exp Med. .

Abstract

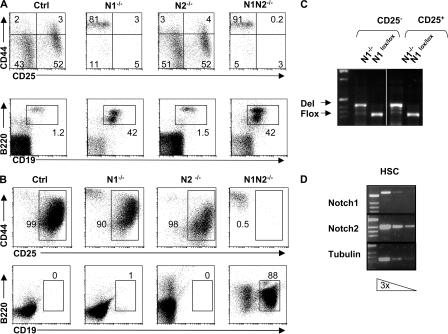
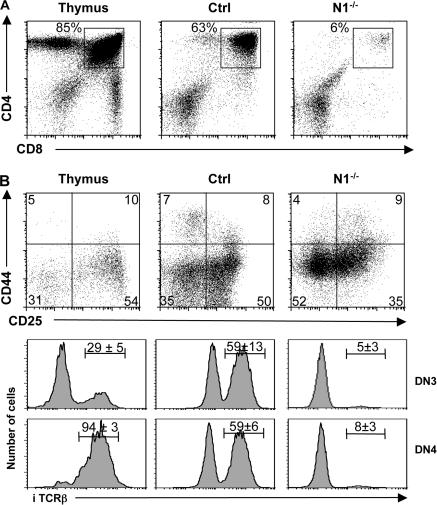
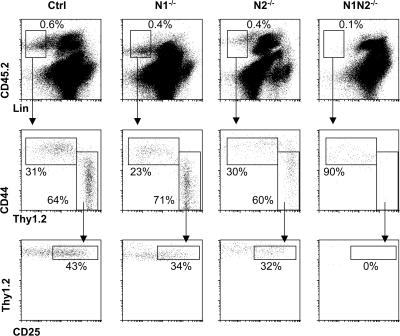
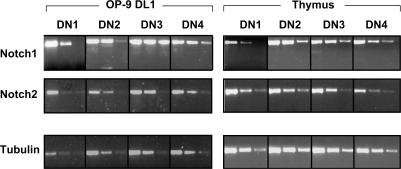
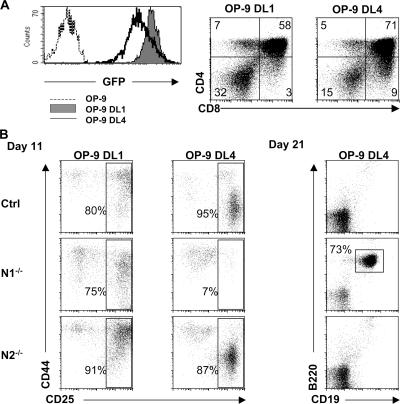
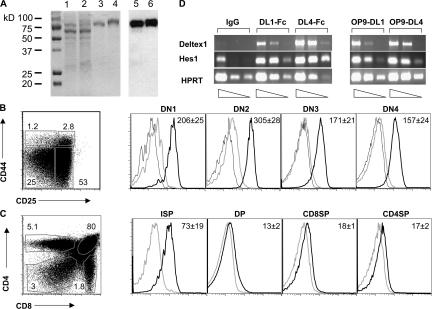
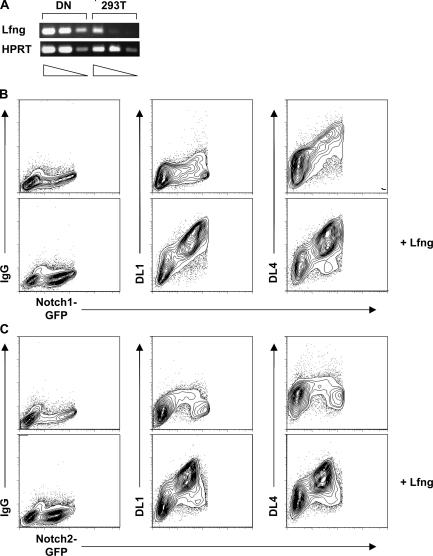
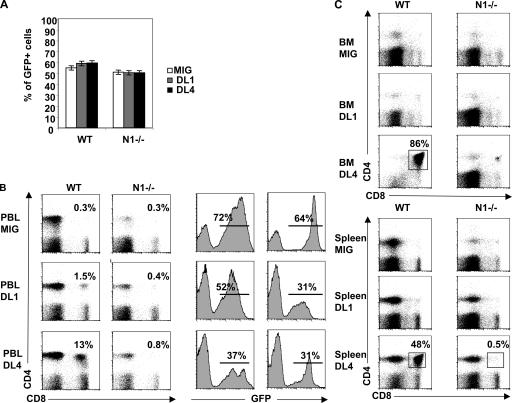
Notch1 (N1) receptor signaling is essential and sufficient for T cell development, and recently developed in vitro culture systems point to members of the Delta family as being the physiological N1 ligands. We explored the ability of Delta1 (DL1) and DL4 to induce T cell lineage commitment and/or maturation in vitro and in vivo from bone marrow (BM) precursors conditionally gene targeted for N1 and/or N2. In vitro DL1 can trigger T cell lineage commitment via either N1 or N2. N1- or N2-mediated T cell lineage commitment can also occur in the spleen after short-term BM transplantation. However, N2-DL1-mediated signaling does not allow further T cell maturation beyond the CD25(+) stage due to a lack of T cell receptor beta expression. In contrast to DL1, DL4 induces and supports T cell commitment and maturation in vitro and in vivo exclusively via specific interaction with N1. Moreover, comparative binding studies show preferential interaction of DL4 with N1, whereas binding of DL1 to N1 is weak. Interestingly, preferential N1-DL4 binding reflects reduced dependence of this interaction on Lunatic fringe, a glycosyl transferase that generally enhances the avidity of Notch receptors for Delta ligands. Collectively, our results establish a hierarchy of Notch-Delta interactions in which N1-DL4 exhibits the greatest capacity to induce and support T cell development.


Figures

Figure 1.
Figure 1.
N2 signaling is sufficient to induce T lineage commitment in vitro but not in vivo. (A) Mixed BM chimeric mice were analyzed 8 wk after reconstitution with a 1:2 mixture of WT (CD45.1+) and Ctrl (N1lox/lox), N1−/−, N2−/−, or N1N2−/− (CD45.2+) BM-derived populations. Representative FACS analysis of thymocytes stained with anti-CD117, -CD44, and -CD25 antibodies after gating on donor (CD45.2+)-derived lineage-negative cells (top). Representative FACS analysis of thymocytes stained with anti-B220 and -CD19 antibodies after gating on donor (CD45.2+)-derived lineage-negative cells (bottom). Representative FACS profiles are derived from experiments in which five mice of each genotype were analyzed. (B) BM KLS cells were sorted from Ctrl, N1−/−, N2−/−, and N1N2−/− mice and cultured on OP9-DL1 cells for 10 d (top) and 18 d (bottom). Cells from these cultures were analyzed for the expression of CD44 and CD25 (top) and for the presence of B220+CD19+ B cells (bottom). Representative FACS profiles are derived from four individual experiments. (C) Deletion PCR analysis for the N1 gene was performed on genomic DNA from sorted CD25 (corresponding to DN1) and CD25+ (corresponding to DN2/DN3) cells derived from N1−/− and Ctrl animals cultured for 10 d on OP9-DL1. (D) Semiquantitative RT-PCR for the expression of N1, N2, and tubulin was performed on sorted BM KLS cells. Three serial dilutions (threefold) of template RNA are shown for the indicated genes.
Figure 2.
Figure 2.
N2 cannot compensate for the loss of N1 function during T cell maturation in vitro. (A) KLS cells from Ctrl and induced N1−/− mice were sorted and cultured on OP-DL1 cells for 20 d. A representative flow cytometric analysis of CD4 versus CD8 of WT thymocytes, and Ctrl and N1−/− KLS cells cultured on OP9-DL1 are shown. (B) Indicated cells were electronically gated on lineage-negative DN thymocytes and analyzed for the expression of CD44 and CD25. Representative histograms for intracellular TCRβ (iTCRβ) expression on DN3 and DN4 thymocytes derived from Ctrl and N1−/− KLS cells 20 d after culture on OP9-DL1 are shown. The numbers above the bars indicate the percentage ± SD of iTCRβ+ cells (n = 4 for WT thymocytes and in vitro culture experiments).
Figure 3.
Figure 3.
N2 is sufficient to specify T lineage progenitors in the spleen after BM transplantation. CD45.2+ Ctrl, N1−/−, N2−/−, or N1N2−/− BM cells were injected into lethally irradiated CD45.1+ hosts. The spleens of host mice were analyzed 12 d after BM transplantation. Representative flow cytometric analyses of donor-derived lineage-negative cells for the expression of CD44 and Thy1.2, and Thy1.2 and CD25, respectively, are shown. Data are representative of four independent experiments.
Figure 4.
Figure 4.
Expression of N1 and N2 in immature DN thymocytes. cDNA was prepared from sorted cells cultured on OP9-DL1 cells for 16 d (corresponding to the DN1–4 subsets), and WT DN1–4 thymocyte subsets. Transcripts of N1 and N2 were analyzed by semiquantitative RT-PCR of threefold dilutions of the cDNA. The cDNA input was normalized according to the expression of the control tubulin gene.
Figure 5.
Figure 5.
Comparison of DL1- and DL4-mediated T cell development in vitro. (A) Histograms show flow cytometric analyses of GFP expression of uninfected OP9-cells (dashed line) and DL1 (shaded histogram) and DL4 (continuous line) retrovirally transduced OP9 cells. Ctrl BM HSCs were sorted and cultured side by side on OP9-DL1 and -DL4 cells and anaylzed by flow cytometry for the expression of CD4 and CD8 30 d after culture. (B) Sorted BM HSCs derived from either Ctrl, N1−/−, or N2−/− mice were cultured for the indicated times on either OP9-DL1 or -DL4 cells and subsequently analyzed by flow cytometry for the expression of CD44 and CD25 (electronically gated on lineage-negative cells) and the presence of B220+CD19+ B cells. Data are representative of four independent experiments.
Figure 6.
Figure 6.
Binding of purified DL1- and DL4-IgG fusion proteins to thymocytes. (A) DL1- (lanes 1 and 3) and DL4-IgG fusion proteins (lanes 2 and 4) before (lanes 1 and 2) and after (lanes 3 and 4) purification over a protein A column were stained with Coommassie blue (left). A Western blot analysis of DL1- (lane 5) and DL4-IgG (lane 6) fusion proteins using an anti–human IgG–horseradish peroxidase–conjugated antibody is also shown (right). (B) The purified DL1- and DL4-IgG fusion proteins were used to stain immature WT thymocytes. Thymocytes were stained with lineage cocktail and anti-CD117, -CD44, and -CD25 antibodies together with DL1- or DL4-IgG fusion proteins. Representative histograms show the staining of DL1- (gray line) and DL4-IgG (bold line) fusion proteins or IgG isotype control (continuous line) gated on the DN1 (CD117+CD44+CD25), DN2 (CD117+CD44+CD25+), DN3 (CD44CD25+), and DN4 (CD44CD25) thymocyte subpopulations. (C) Representative histograms showing staining of DL1- (gray line) and DL4-IgG (bold line) fusion proteins gated on ISP (CD8+TCRβ), DP (CD4+CD8+), CD4SP (CD4+TCRβ+), and CD8SP (CD8+TCRβ+) thymocytes. In the more mature thymocyte subsets (ISP, DP, and SP), DL1-IgG staining was indistinguishable from the IgG isotype control, which is therefore not shown in C. Data are representative of four independent experiments, and numbers within the histograms indicate means ± SD of the mean fluorescence intensity for DL4. (D) Semiquantitative RT-PCR for the Notch target genes Deltex1 and Hes1. cDNA was prepared from DN thymocytes, either cultured for 20 h on IgG-, (DL1-IgG) DL1-Fc–, and DL4-Fc–coated plastic dishes or on OP9-DL1 or -DL4 cells. Transcripts of Deltex1 and Hes1 were analyzed by semiquantitative RT-PCR of threefold dilutions of the cDNA. The cDNA input was normalized according to the expression of the control HPRT gene.
Figure 7.
Figure 7.
Binding of DL1- and DL4-IgG fusion proteins to N1 and N2. (A) Semiquantitative RT-PCR for the Lfng gene. cDNAs were prepared from DN thymocytes and 293T cells. Transcripts were analyzed by semiquantitative RT-PCR of fivefold dilutions of the cDNA. The cDNA input was normalized according to the expression of the control HPRT gene. 293T cells were transiently transfected with N1- (B) or N2-EGFP (C) together with or without Lfng expression vectors and stained 48 h after transfection with either human IgG1 isotype control or DL1- or DL4-IgG fusion proteins. Data are representative FACS profiles of four independent experiments. Extremely high EGFP-expressing cells were gated out as the fusion proteins were trapped inside the cells.
Figure 8.
Figure 8.
Comparative in vivo analysis of DL1 and DL4 for their ability to promote ectopic T cell development. (A) Bar diagrams show percentages of GFP+ Ctrl and N1−/− BM cells after transduction with the control virus (MIG) and virus expressing DL1 and DL4. (B) Histograms show the percentage of GFP+ cells within total PBLs in host mice 9 wk after BM transplantation. Flow cytometric analysis for the presence of CD4- and CD8-expressing T cells was performed on PBLs (B) and BM and spleen (C) of host animals that were transplanted with WT and N1−/− BM cells expressing the indicated ligands.

Similar articles

Cited by

References

    1. Rothenberg, E.V. 2000. Stepwise specification of lymphocyte developmental lineages. Curr. Opin. Genet. Dev. 10:370–379. - PubMed
    1. Godfrey, D.I., and A. Zlotnik. 1993. Control points in early T-cell development. Immunol. Today. 14:547–553. - PubMed
    1. Rodewald, H.R., and H.J. Fehling. 1998. Molecular and cellular events in early thymocyte development. Adv. Immunol. 69:1–112. - PubMed
    1. Radtke, F., A. Wilson, S.J. Mancini, and H.R. MacDonald. 2004. Notch regulation of lymphocyte development and function. Nat. Immunol. 5:247–253. - PubMed
    1. Maillard, I., T. Fang, and W.S. Pear. 2005. Regulation of lymphoid development, differentiation, and function by the Notch pathway. Annu. Rev. Immunol. 23:945–974. - PubMed

Publication types

MeSH terms