. 2007 Feb 6;104(6):1983-8.
doi: 10.1073/pnas.0610779104. Epub 2007 Jan 29.

The power of automated high-resolution behavior analysis revealed by its application to mouse models of Huntington's and prion diseases

Affiliations

The power of automated high-resolution behavior analysis revealed by its application to mouse models of Huntington's and prion diseases

Andrew D Steele et al. Proc Natl Acad Sci U S A. .

Abstract

Automated analysis of mouse behavior will be vital for elucidating the genetic determinants of behavior, for comprehensive analysis of human disease models, and for assessing the efficacy of various therapeutic strategies and their unexpected side effects. We describe a video-based behavior-recognition technology to analyze home-cage behaviors and demonstrate its power by discovering previously unrecognized features of two already extensively characterized mouse models of neurodegenerative disease. The severe motor abnormalities in Huntington's disease mice manifested in our analysis by decreased hanging, jumping, stretching, and rearing. Surprisingly, behaviors such as resting and grooming were also affected. Unexpectedly, mice with infectious prion disease showed profound increases in activity at disease onset: rearing increased 2.5-fold, walking 10-fold and jumping 30-fold. Strikingly, distinct behaviors were altered specifically during day or night hours. We devised a systems approach for multiple-parameter phenotypic characterization and applied it to defining disease onset robustly and at early time points.


Conflict of interest statement

Conflict of interest statement: A.D.S., W.S.J., O.D.K., and S.L. initially purchased HCS and received an additional software license in exchange for assistance with further refinement of the program. None of the authors have received remuneration from Clever Systems, Inc. as a stockholder, consultant, or employee.

Figures

Fig. 1.
Fig. 1.
Behavioral alterations in Huntington's and PrD mice. (A–H) Mean values (±SEM) for HD and controls are shown for rest (A), awaken (B), twitch (C), distance traveled (D), groom (E), hang vertical (F), stretch (G), and jump (H). (I–P) Mean values for PrD and controls are shown for rest (I), awaken (J), twitch (K), distance traveled (L), groom (M), sniff (N), rear (O), and jump (P). P values were computed by using a two-tailed Wilcoxon rank-sum test (nonparametric) and are indicated as follows ∗, P < 0.05; ∗∗, P < 0.01; and ∗∗∗, P < 0.001 (sample sizes for HD were n = 5 HD Tg and WT control pairs for week 5, n = 7 for weeks 6–11, n = 6 for week 12, and n = 4 for week 13; for PrD, n = 8 for every time point except for 5 m.p.i., where n = 7 prion and n = 8 controls).
Fig. 2.
Fig. 2.
Behavioral alterations with respect to light and dark phases in HD and PrD mice. (A–D) Resting at 6 weeks (A) and 11 weeks (B) and hanging vertical at 6 weeks (C) and 11 weeks (D) are displayed in 1-h bins for HD mice (red line) and controls (black line). (E–H) Resting at 2 m.p.i. (E) and at 5 m.p.i. (F) and walking at 2 m.p.i. (G) and 5 m.p.i. (H) are displayed in 1-h bins for PrD mice (blue line) and controls (black line). Shaded boxes represent the dark cycle (7 p.m. to 7 a.m.). P values were computed by using a two-tailed Mann–Whitney test (nonparametric) and are indicted as follows ∗, P < 0.05; ∗∗, P < 0.01; and ∗∗∗, P < 0.001. Sample sizes for each time point are n = 7 HD Tg and n = 7 WT controls (A–D) and n = 8 prion and n = 8 controls (E–H).
Fig. 3.
Fig. 3.
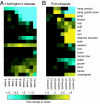
Phenotypic arrays of HD and PrD behaviors over time. Mean values for HD (A) or PrD (B) were divided by mean control values to give the fold increase or decrease in the behaviors listed. The fold increase or decrease is indicated in the figure as increasing intensity of blue for negative fold changes or yellow for positive fold changes.
Fig. 4.
Fig. 4.
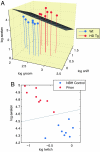
Multifeature analyses to separate diseased from control mice. (A) A three-dimensional plot of the log of awaken, groom, and sniff behaviors that discriminate HD mice from control mice at 7 weeks of age. (B) A two-dimensional plot that separates PrD mice from controls at 4 m.p.i. by using the log of awaken and twitch.

Similar articles

Cited by

References

    1. Auwerx J, Avner P, Baldock R, Ballabio A, Balling R, Barbacid M, Berns A, Bradley A, Brown S, Carmeliet P, et al. Nat Genet. 2004;36:925–927. - PMC - PubMed
    1. Brown SD, Chambon P, de Angelis MH. Nat Genet. 2005;37:1155. - PubMed
    1. Arndt SS, Surjo D. Behav Brain Res. 2001;125:39–42. - PubMed
    1. Kafkafi N, Benjamini Y, Sakov A, Elmer GI, Golani I. Proc Natl Acad Sci USA. 2005;102:4619–4624. - PMC - PubMed
    1. Crabbe JC, Wahlsten D, Dudek BC. Science. 1999;284:1670–1672. - PubMed

Publication types