. 2007 Feb 1;79(3):1073-81.
doi: 10.1021/ac061798t.

Relative information content and top-down proteomics by mass spectrometry: utility of ion/ion proton-transfer reactions in electrospray-based approaches

Affiliations

Relative information content and top-down proteomics by mass spectrometry: utility of ion/ion proton-transfer reactions in electrospray-based approaches

Jian Liu et al. Anal Chem. .

Abstract

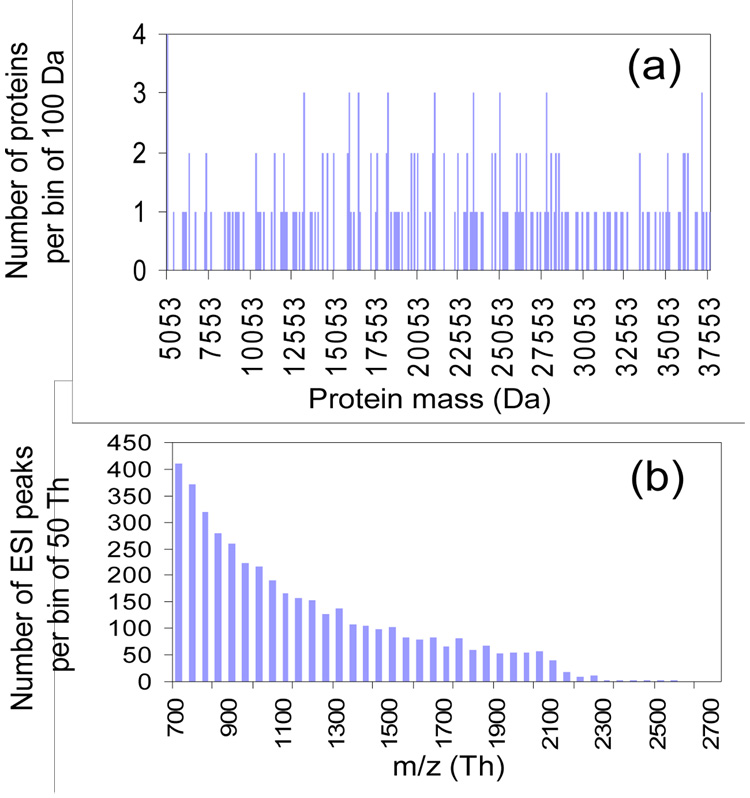
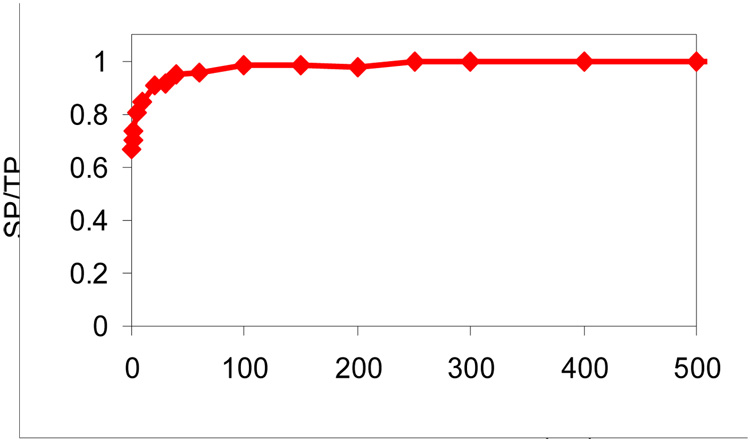
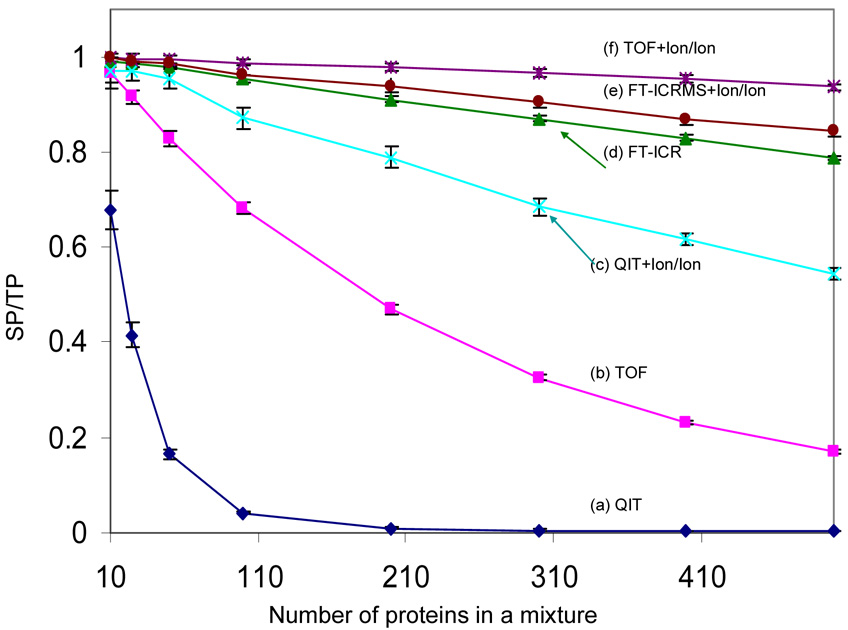
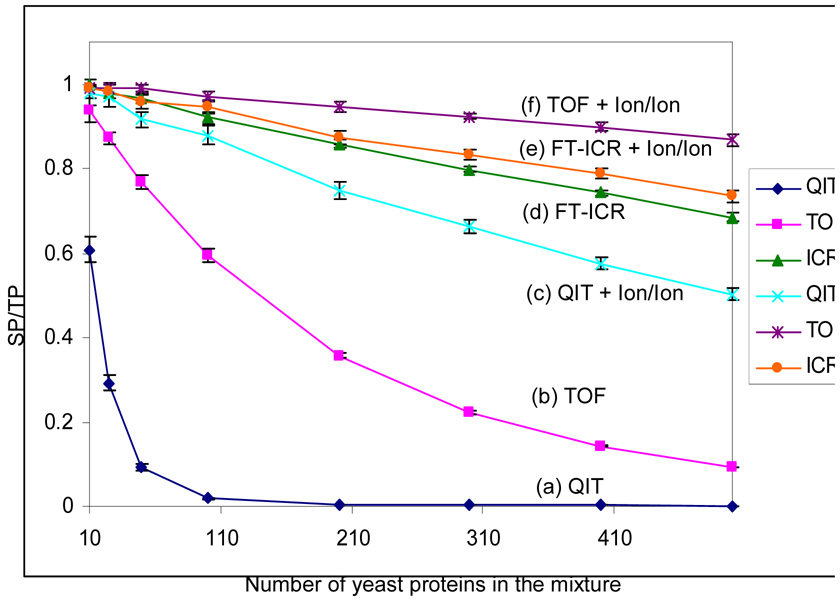
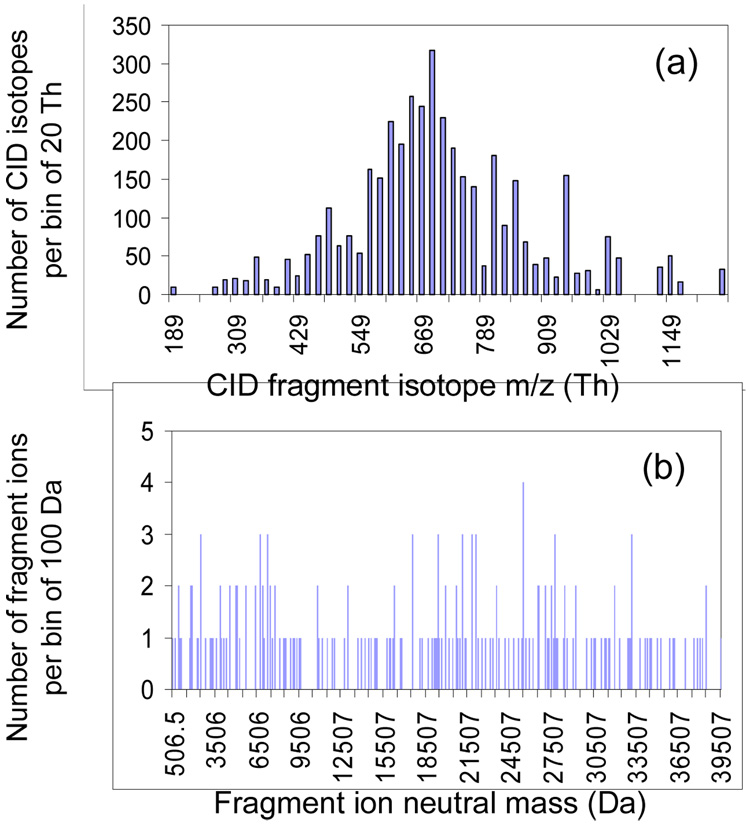
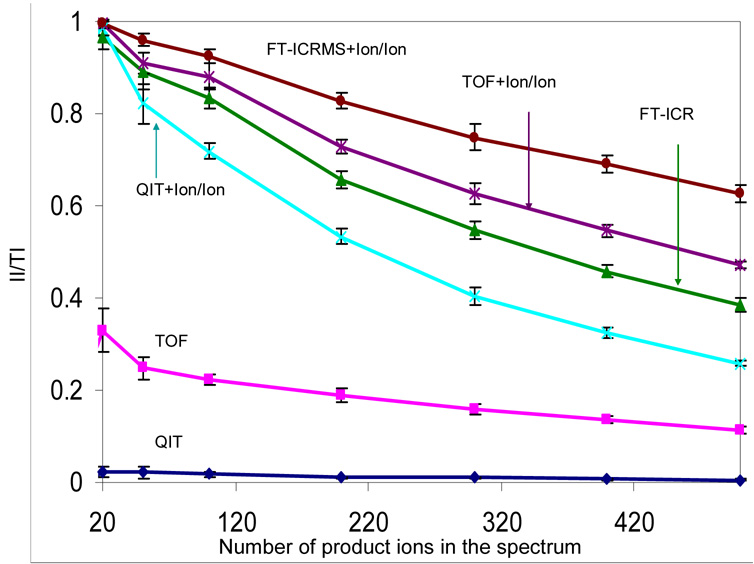
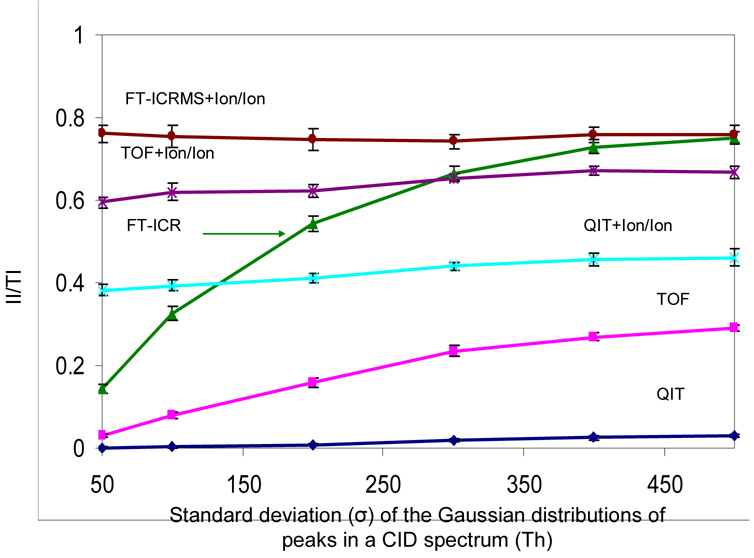
Computer simulations of electrospray ionization (ESI) and collision-induced dissociation (CID) experiments were employed to examine the informing power associated with "top-down" proteomics implemented with some commonly used mass analyzers, i.e., the quadrupole ion trap (QIT), the Fourier transform-ion cyclotron resonance mass spectrometer (FT-ICRMS), and the time-of-flight (TOF) mass spectrometer. Using a ratio of the separated (or resolved) peaks to the total number of predicted peaks as a measure of informing power, the ESI-MS simulation of a mixture of proteins showed that the FT-ICRMS exhibited the highest informing power among the three instruments being studied, with the QIT giving the lowest informing power, which was expected from the analysis of the "component capacity" of the three approaches. Also as expected on the basis of resolving elements per component, a dramatic increase in the informing power of the approach was obtained when ion/ion proton-transfer reactions were used to reduce the number of peaks and to minimize overlap between ions of different mass and charge but similar mass-to-charge ratio. With the assumptions made in this study, the informing power of the TOF + ion/ion approach rivaled or even exceeded that of the FT-ICRMS approach, despite significantly lower mass resolution. This result stemmed from both a reduction in the number of peaks and their dispersion over a much wider range of mass-to-charge ratios. Similar results were obtained from the CID simulation, where the informing power of different approaches was evaluated on the basis of the ratio of the number of ions for which a mass could be determined unambiguously to the total number of ions in the spectra.


Figures

Figure 1
Figure 1
(a) The mass distribution of 200 proteins (bin size = 100 Da) randomly generated over 5,000 – 50,000 Da with uniform probability and (b) the m/z distribution (bin size = 50 Th) of the ESI peaks produced by these 200 proteins.
Figure 2
Figure 2
SP/TP (ratio of separated peaks to total predicted peaks) from TOF mass spectra as a function of ion/ion reaction time for a mixture of 100 proteins.
Figure 3
Figure 3
Comparison of the SP/TP (ratio of resolved peaks to the total number of predicted peaks) from six mass spectrometry based approaches: (a) QIT, (b) TOF, (c) QIT coupled with ion/ion reaction, (d) FT-ICRMS, (e) FT-ICRMS coupled with ion/ion reaction and (f) TOF coupled with ion/ion reaction (ion/ion reaction time: 500 ms), in the context of the ESI simulation. Each data point is the average of 20 simulations and the error bars reflect the standard deviation.
Figure 4
Figure 4
Comparison of the SP/TP (ratio of separated peaks to the total number of predicted peaks) from six mass spectrometry based approaches: (a) QIT, (b) TOF, (c) QIT coupled with ion/ion reaction, (d) FT-ICRMS and (e) FT-ICRMS coupled with ion/ion reaction and (f) TOF coupled with ion/ion reaction (ion/ion reaction time: 500 ms), in the context of the ESI simulation. Each data point is the average of 20 simulations and the error bars reflect the standard deviation.
Figure 5
Figure 5
Bar graphs of (a) the isotope m/z distribution and (b) the neutral mass distribution of 200 product ions derived from CID simulation on a +57 precursor ion with m/z 700 Th. The fragment ion m/z was generated randomly with a probability of Gaussian distribution having a mean of 700 Th and a standard deviation of 200 Th, and the charge on the ion is randomly generated with uniform probability from +1 to +57.
Figure 6
Figure 6
Comparison of the informing power of six mass spectrometry based approaches, QIT, TOF, FT-ICRMS, QIT coupled with ion/ion reaction, TOF coupled with ion/ion reaction and FT-ICRMS coupled with ion/ion reaction in the context of the CID simulation. All sets of product ions have a Gaussian distribution with a mean of 700 Th and standard deviation of 200 Th. Data are averaged from 20 simulations and the error bars show the standard deviation.
Figure 7
Figure 7
The effect of peak distribution in a CID spectrum on the informing power of six mass spectrometry based approaches, QIT, TOF, FT-ICRMS, QIT coupled with ion/ion reaction, TOF coupled with ion/ion reaction and FT-ICRMS coupled with ion/ion reaction, in the context of the CID simulation. A mixture of 300 product ions was employed in the simulation. Data are averaged from 20 simulations and the error bar is the standard deviation of the repeated simulation results.

Similar articles

Cited by

References

    1. Fenn JB, Mann M, Meng CK, Wong SF, Whitehouse CM. Science. 1989;246:64–71. - PubMed
    1. Fenn JB, Mann M, Meng CK, Wong SF, Whitehouse CM. Mass Spectrom. Rev. 1990;9:37–70.
    1. Smith RD, Loo JA, Edmonds CG, Barinaga CJ, Udseth HR. Anal. Chem. 1990;62:882–899. - PubMed
    1. Busman M, Rockwood AL, Smith RD. J. Phys. Chem. 1992;96:2397–2400.
    1. Rockwood AL, Busman M, Smith RD. Int. J. Mass Spectrom. Ion Processes. 1991;111:103–129.

Publication types