

Distinct reaction pathways followed upon reduction of oxy-heme oxygenase and oxy-myoglobin as characterized by Mössbauer spectroscopy
- PMID: 17263425
- PMCID: PMC2519892
- DOI: 10.1021/ja067209i
Distinct reaction pathways followed upon reduction of oxy-heme oxygenase and oxy-myoglobin as characterized by Mössbauer spectroscopy
Erratum in
- J Am Chem Soc. 2007 May 23;129(20):6662
Abstract
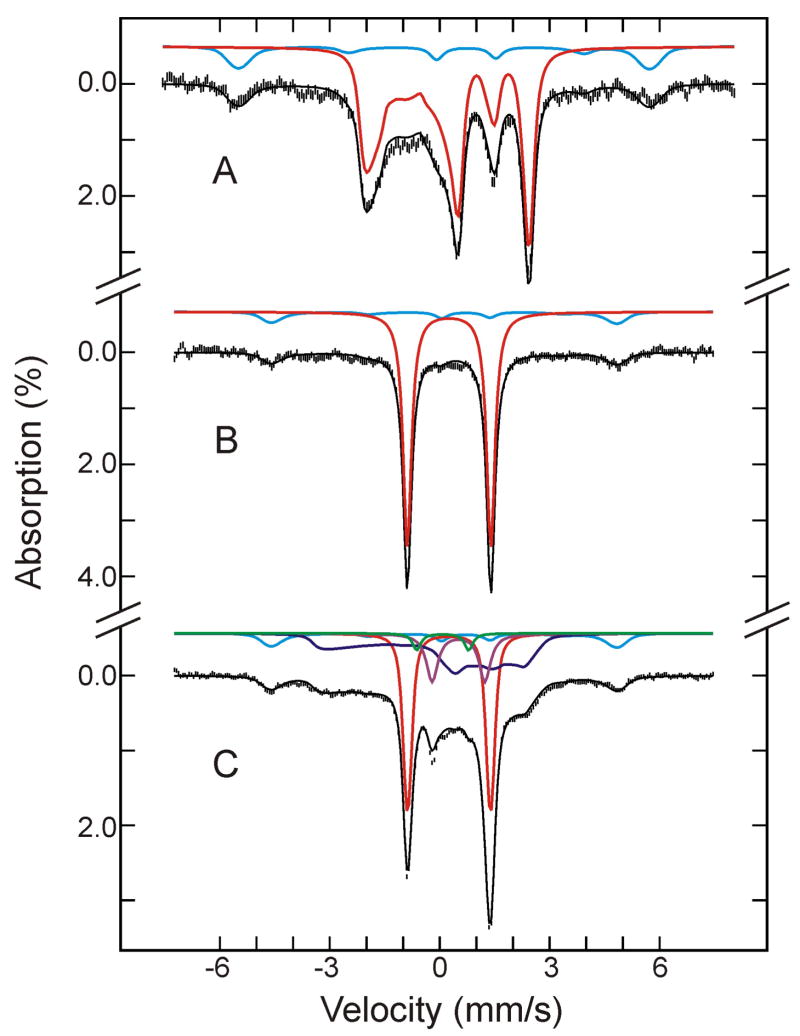
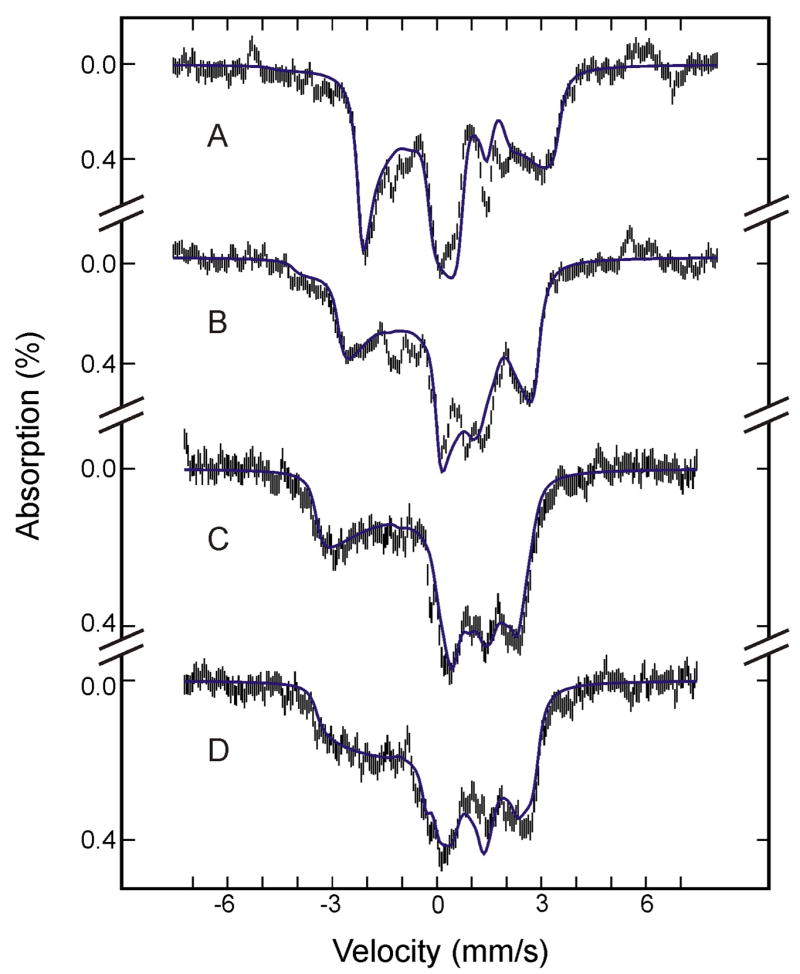
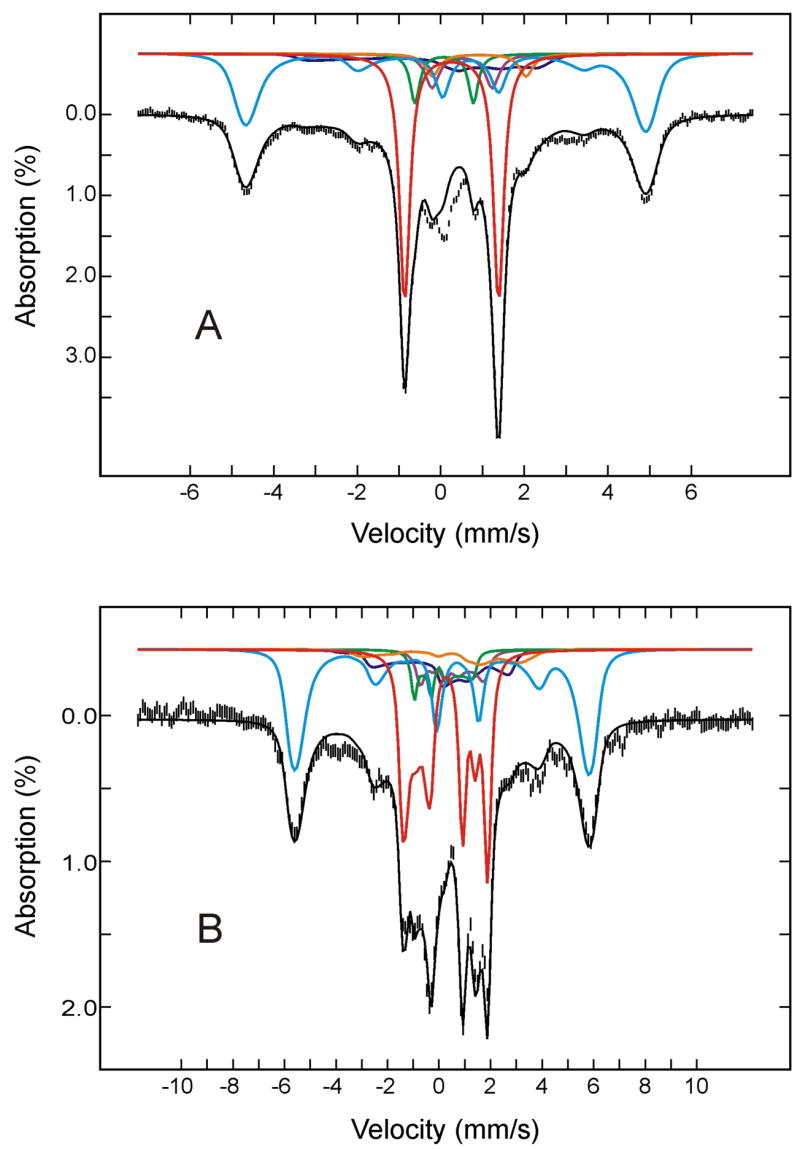
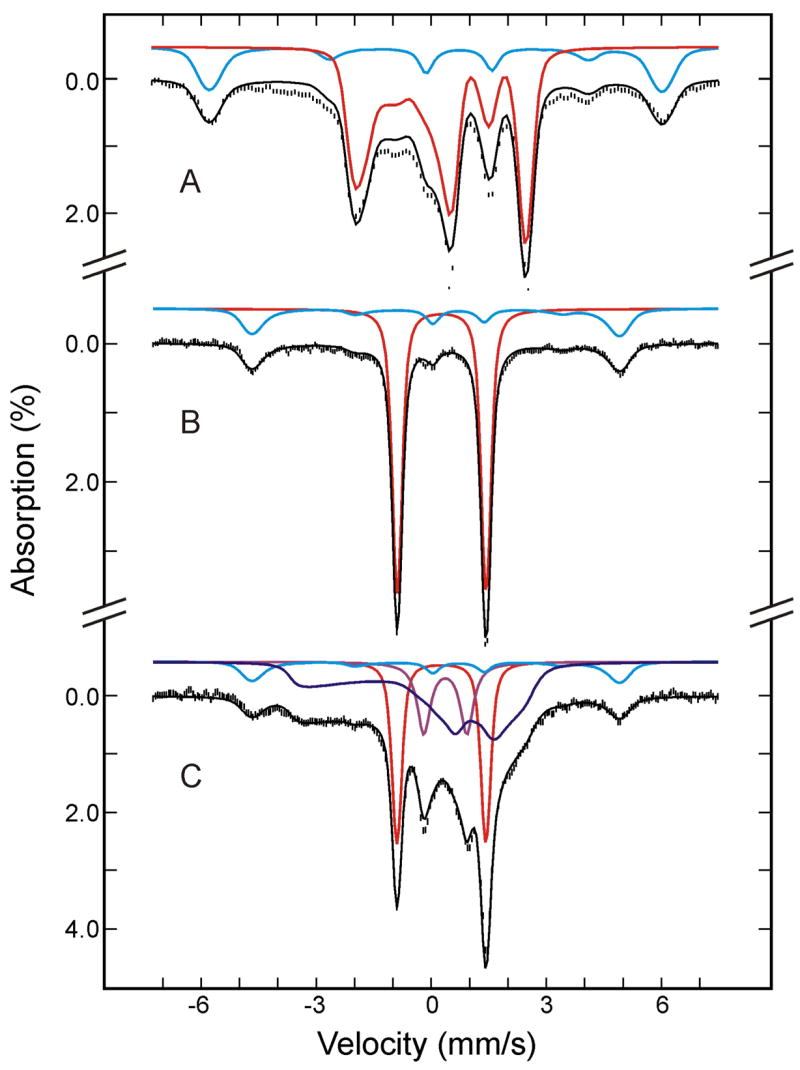
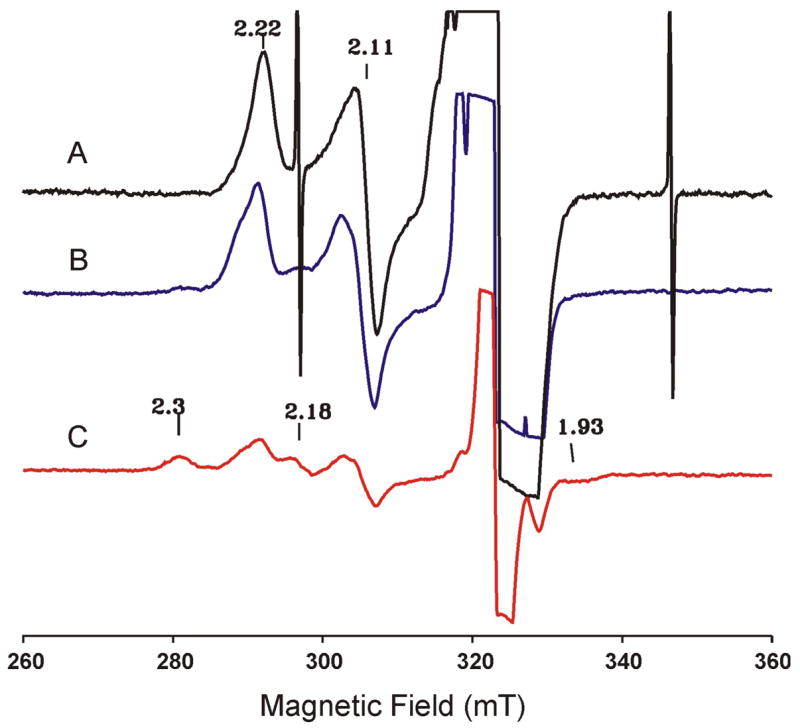
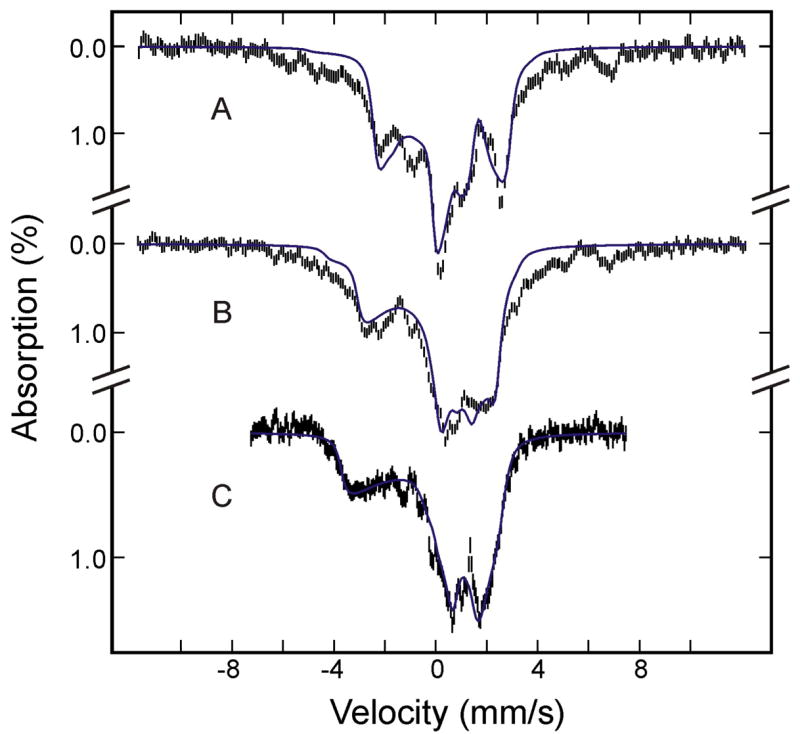
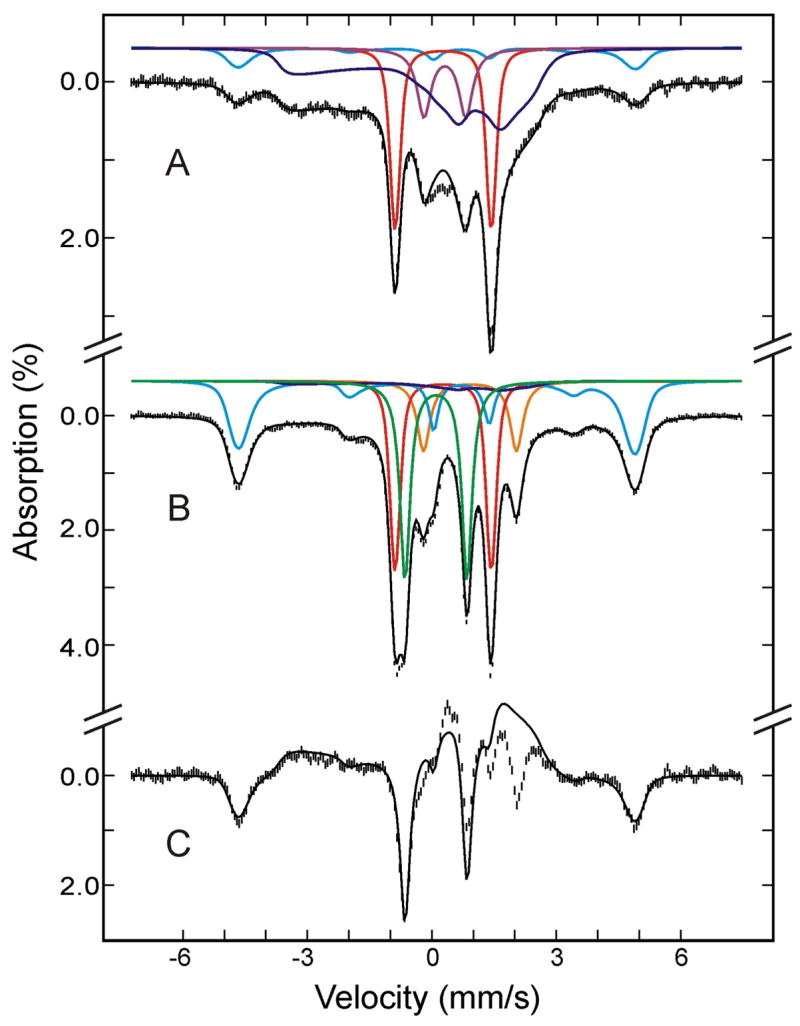
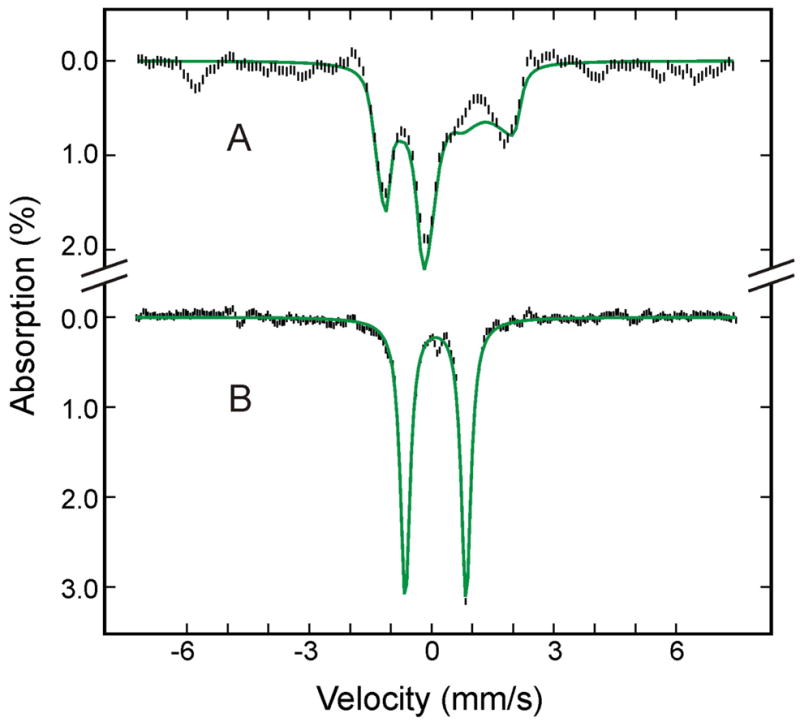
Activation of O(2) by heme-containing monooxygenases generally commences with the common initial steps of reduction to the ferrous heme and binding of O(2) followed by a one-electron reduction of the O(2)-bound heme. Subsequent steps that generate reactive oxygen intermediates diverge and reflect the effects of protein control on the reaction pathway. In this study, Mössbauer and EPR spectroscopies were used to characterize the electronic states and reaction pathways of reactive oxygen intermediates generated by 77 K radiolytic cryoreduction and subsequent annealing of oxy-heme oxygenase (HO) and oxy-myoglobin (Mb). The results confirm that one-electron reduction of (Fe(II)-O(2))HO is accompanied by protonation of the bound O(2) to generate a low-spin (Fe(III)-O(2)H(-))HO that undergoes self-hydroxylation to form the alpha-meso-hydroxyhemin-HO product. In contrast, one-electron reduction of (Fe(II)-O(2))Mb yields a low-spin (Fe(III)-O(2)(2-))Mb. Protonation of this intermediate generates (Fe(III)-O(2)H(-))Mb, which then decays to a ferryl complex, (Fe(IV)=O(2-))Mb, that exhibits magnetic properties characteristic of the compound II species generated in the reactions of peroxide with heme peroxidases and with Mb. Generation of reactive high-valent states with ferryl species via hydroperoxo intermediates is believed to be the key oxygen-activation steps involved in the catalytic cycles of P450-type monooxygenases. The Mössbauer data presented here provide direct spectroscopic evidence supporting the idea that ferric-hydroperoxo hemes are indeed the precursors of the reactive ferryl intermediates. The fact that a ferryl intermediate does not accumulate in HO underscores the determining role played by protein structure in controlling the reactivity of reaction intermediates.
Figures
Similar articles
-
EPR and ENDOR studies of cryoreduced compounds II of peroxidases and myoglobin. Proton-coupled electron transfer and protonation status of ferryl hemes.Biochemistry. 2008 May 6;47(18):5147-55. doi: 10.1021/bi702514d. Epub 2008 Apr 12. Biochemistry. 2008. PMID: 18407661
-
Catalytic mechanism of heme oxygenase through EPR and ENDOR of cryoreduced oxy-heme oxygenase and its Asp 140 mutants.J Am Chem Soc. 2002 Feb 27;124(8):1798-808. doi: 10.1021/ja0122391. J Am Chem Soc. 2002. PMID: 11853459
-
Heme oxygenase reveals its strategy for catalyzing three successive oxygenation reactions.Acc Chem Res. 2010 Feb 16;43(2):240-7. doi: 10.1021/ar9001685. Acc Chem Res. 2010. PMID: 19827796
-
Dioxygen activation for the self-degradation of heme: reaction mechanism and regulation of heme oxygenase.Inorg Chem. 2010 Apr 19;49(8):3602-9. doi: 10.1021/ic901869t. Inorg Chem. 2010. PMID: 20380462 Review.
-
Mechanism of heme degradation by heme oxygenase.J Inorg Biochem. 2000 Nov;82(1-4):33-41. doi: 10.1016/s0162-0134(00)00156-2. J Inorg Biochem. 2000. PMID: 11132636 Review.
Cited by
-
Heme utilization by pathogenic bacteria: not all pathways lead to biliverdin.Acc Chem Res. 2014 Aug 19;47(8):2291-8. doi: 10.1021/ar500028n. Epub 2014 May 29. Acc Chem Res. 2014. PMID: 24873177 Free PMC article.
-
Crystallographic and spectroscopic insights into heme degradation by Mycobacterium tuberculosis MhuD.Inorg Chem. 2014 Jun 16;53(12):5931-40. doi: 10.1021/ic500033b. Epub 2014 Jun 5. Inorg Chem. 2014. PMID: 24901029 Free PMC article.
-
Manganese and Cobalt in the Nonheme-Metal-Binding Site of a Biosynthetic Model of Heme-Copper Oxidase Superfamily Confer Oxidase Activity through Redox-Inactive Mechanism.J Am Chem Soc. 2017 Sep 6;139(35):12209-12218. doi: 10.1021/jacs.7b05800. Epub 2017 Aug 25. J Am Chem Soc. 2017. PMID: 28768416 Free PMC article.
-
Oxygen Activation and Radical Transformations in Heme Proteins and Metalloporphyrins.Chem Rev. 2018 Mar 14;118(5):2491-2553. doi: 10.1021/acs.chemrev.7b00373. Epub 2017 Dec 29. Chem Rev. 2018. PMID: 29286645 Free PMC article. Review.
-
Heme-copper and Heme O2-derived synthetic (bioinorganic) chemistry toward an understanding of cytochrome c oxidase dioxygen chemistry.J Inorg Biochem. 2023 Dec;249:112367. doi: 10.1016/j.jinorgbio.2023.112367. Epub 2023 Sep 9. J Inorg Biochem. 2023. PMID: 37742491 Free PMC article. Review.
References
-
- Sono M, Roach MP, Coulter ED, Dawson JH. Chem Rev. 1996;96:2841–2887. - PubMed
-
- Davydov R, Macdonald IDG, Makris TM, Sligar SG, Hoffman BM. J Am Chem Soc. 1999;121:10654–10655.
-
- Davydov RM, Yoshida T, Ikeda-Saito M, Hoffman BM. J Am Chem Soc. 1999;121:10656–10657.
-
- Davydov R, Makris TM, Kofman V, Werst DE, Sligar SG, Hoffman BM. J Am Chem Soc. 2001;123:1403–1415. - PubMed
-
- Davydov R, Kofman V, Fujii H, Yoshida T, Ikeda-Saito M, Hoffman BM. J Am Chem Soc. 2002;124:1798–1808. - PubMed
Publication types
MeSH terms
Substances
Grants and funding
LinkOut - more resources
Full Text Sources
Miscellaneous
