

A bird's eye view: using geographic analysis to evaluate the representativeness of corvid indicators for West Nile virus surveillance
- PMID: 17263891
- PMCID: PMC1796857
- DOI: 10.1186/1476-072X-6-3
A bird's eye view: using geographic analysis to evaluate the representativeness of corvid indicators for West Nile virus surveillance
Abstract
Background: The objective of this evaluation was to determine whether reports of dead corvid sightings and submissions of dead corvids for West Nile virus testing were representative of true corvid mortality in British Columbia in 2004, a year with no West Nile virus activity, in order to ensure the system was accurately describing corvid mortality rather than reflecting regional differences in surveillance methods.
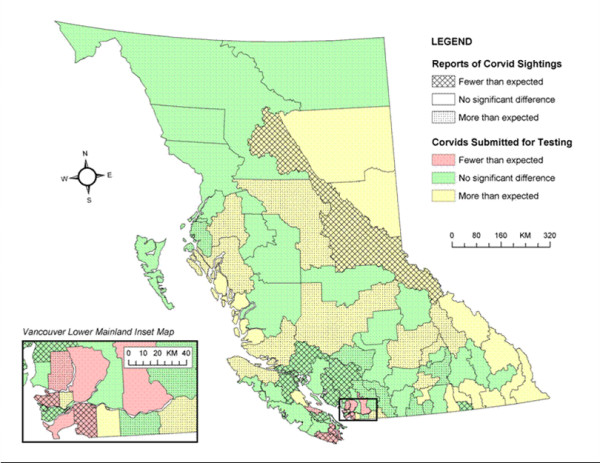
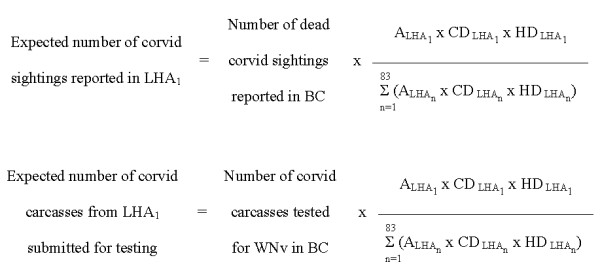
Results: Local Health Areas reported 0-159 (median = 3) dead corvid sightings and 0-209 (median = 5) submissions for West Nile virus testing. The expected numbers of dead corvid sightings and submissions for testing from each Local Health Area were 0-232 (median = 3) and 0-258 (median = 4), respectively. Twelve Local Health Areas reported significantly fewer sightings than expected; 21 reported significantly more. Eleven Local Health Areas submitted significantly fewer corvids than expected; 26 submitted significantly more.
Conclusion: Some Local Health Areas were over-represented and others under-represented in terms of corvid West Nile virus surveillance indicators. Recommendations were made to improve the representativeness of corvid surveillance data. Geographic analysis can be used to evaluate the representativeness of surveillance systems and result in improvements to surveillance.
Figures
Similar articles
-
A comparison of West Nile virus surveillance using survival analyses of dead corvid and mosquito pool data in Ontario, 2002-2008.Prev Vet Med. 2015 Dec 1;122(3):363-70. doi: 10.1016/j.prevetmed.2015.10.007. Epub 2015 Oct 19. Prev Vet Med. 2015. PMID: 26520177
-
"Neon needles" in a haystack: the advantages of passive surveillance for West Nile virus.Ann N Y Acad Sci. 2001 Dec;951:38-53. Ann N Y Acad Sci. 2001. PMID: 11797803 Review.
-
Avian mortality surveillance for West Nile virus in Colorado.Am J Trop Med Hyg. 2007 Mar;76(3):431-7. Am J Trop Med Hyg. 2007. PMID: 17360863
-
A geographic study of West Nile virus in humans, dead corvids and mosquitoes in Ontario using spatial scan statistics with a survival time application.Zoonoses Public Health. 2017 Nov;64(7):e81-e89. doi: 10.1111/zph.12350. Epub 2017 Feb 20. Zoonoses Public Health. 2017. PMID: 28220657
-
West Nile virus in North America: perspectives on epidemiology and intervention.Pest Manag Sci. 2007 Jul;63(7):641-6. doi: 10.1002/ps.1325. Pest Manag Sci. 2007. PMID: 17373672 Review.
Cited by
-
It takes a community to raise the prevalence of a zoonotic pathogen.Interdiscip Perspect Infect Dis. 2011;2011:741406. doi: 10.1155/2011/741406. Epub 2011 Nov 21. Interdiscip Perspect Infect Dis. 2011. PMID: 22162687 Free PMC article.
-
Exploring the spatio-temporal dynamics of reservoir hosts, vectors, and human hosts of West Nile virus: a review of the recent literature.Int J Environ Res Public Health. 2013 Oct 25;10(11):5399-432. doi: 10.3390/ijerph10115399. Int J Environ Res Public Health. 2013. PMID: 24284356 Free PMC article. Review.
-
The geosimulation of West Nile virus propagation: a multi-agent and climate sensitive tool for risk management in public health.Int J Health Geogr. 2008 Jul 7;7:35. doi: 10.1186/1476-072X-7-35. Int J Health Geogr. 2008. PMID: 18606008 Free PMC article.
-
Delineating West Nile Virus Transmission Cycles at Various Scales: The Nearest Neighbor Distance-Time Model.Cartogr Geogr Inf Sci. 2010 Apr 1;37(2):149-163. doi: 10.1559/152304010791232208. Cartogr Geogr Inf Sci. 2010. PMID: 23144590 Free PMC article.
References
-
- Heymann DL, editor. Control of Communicable Diseases Manual. 18th. Washington, American Public Health Association; 2004.
-
- West Nile Virus MONITOR. 2004. http://www.phac-aspc.gc.ca/wnv-vwn/index.html
-
- West Nile Virus: Statistics, Surveillance, and Control. 2006. http://www.cdc.gov/ncidod/dvbid/westnile/surv&control.htm
-
- Petersen LR, Marfin AA. West Nile virus: a primer for the clinician. Ann Intern Med. 2002;137:173–179. - PubMed
Publication types
MeSH terms
LinkOut - more resources
Full Text Sources
Medical
Molecular Biology Databases
