Review
. 2007 Oct;55(2):356-72.
doi: 10.1016/j.brainresrev.2006.12.006. Epub 2006 Dec 29.

Quest for the basic plan of nervous system circuitry

Affiliations
Review

Quest for the basic plan of nervous system circuitry

Larry W Swanson. Brain Res Rev. 2007 Oct.

Abstract

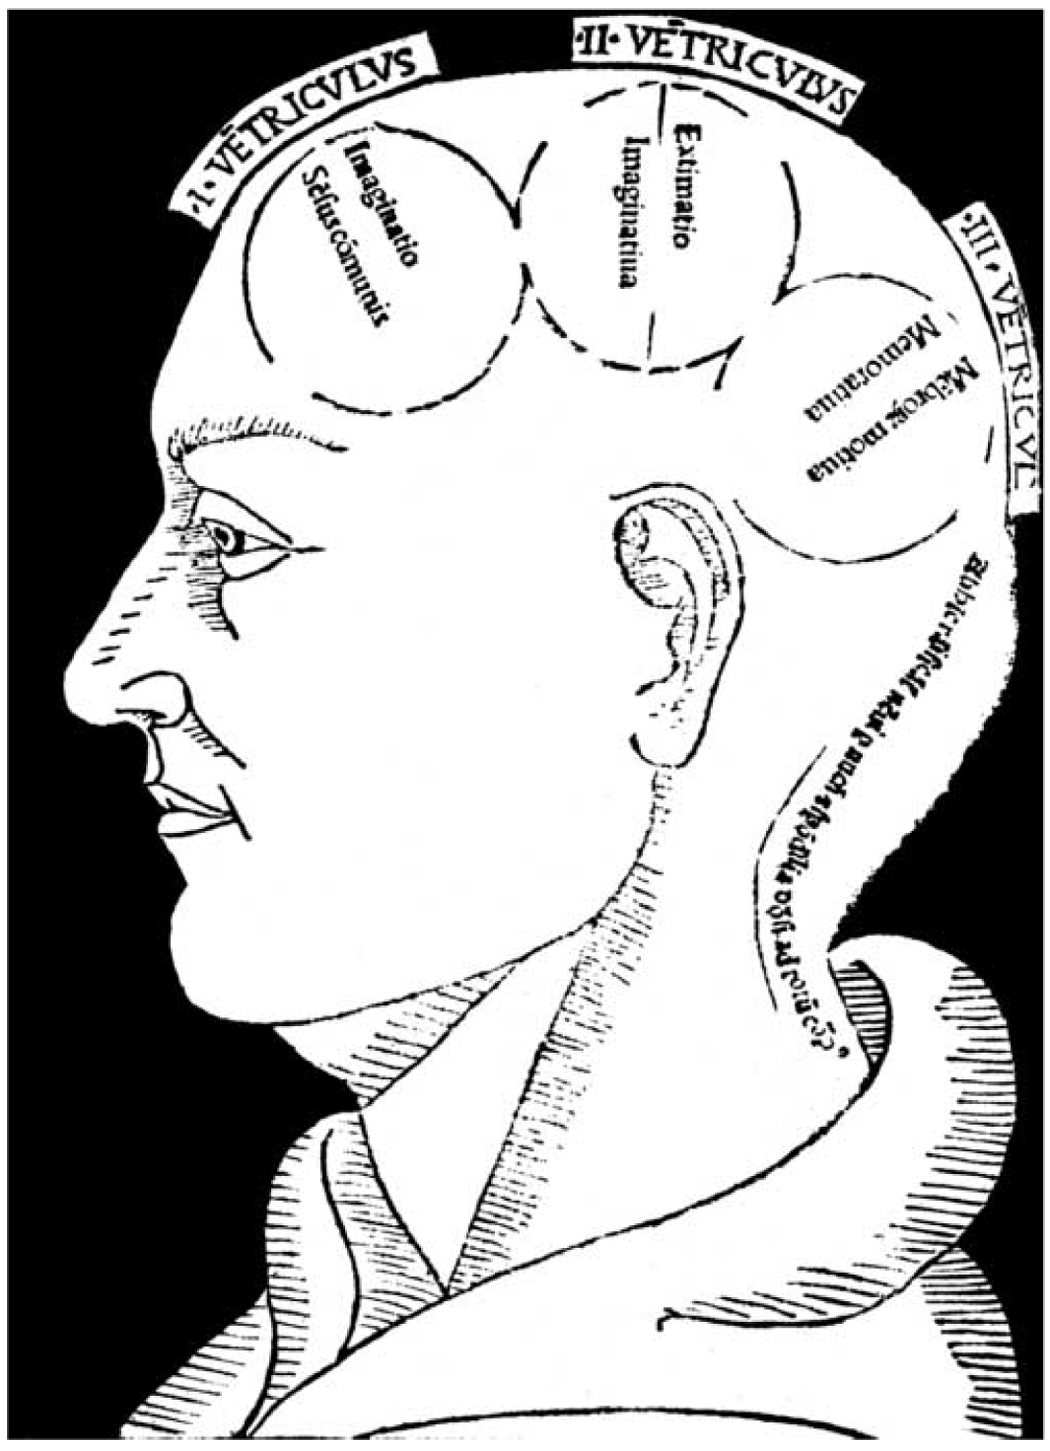
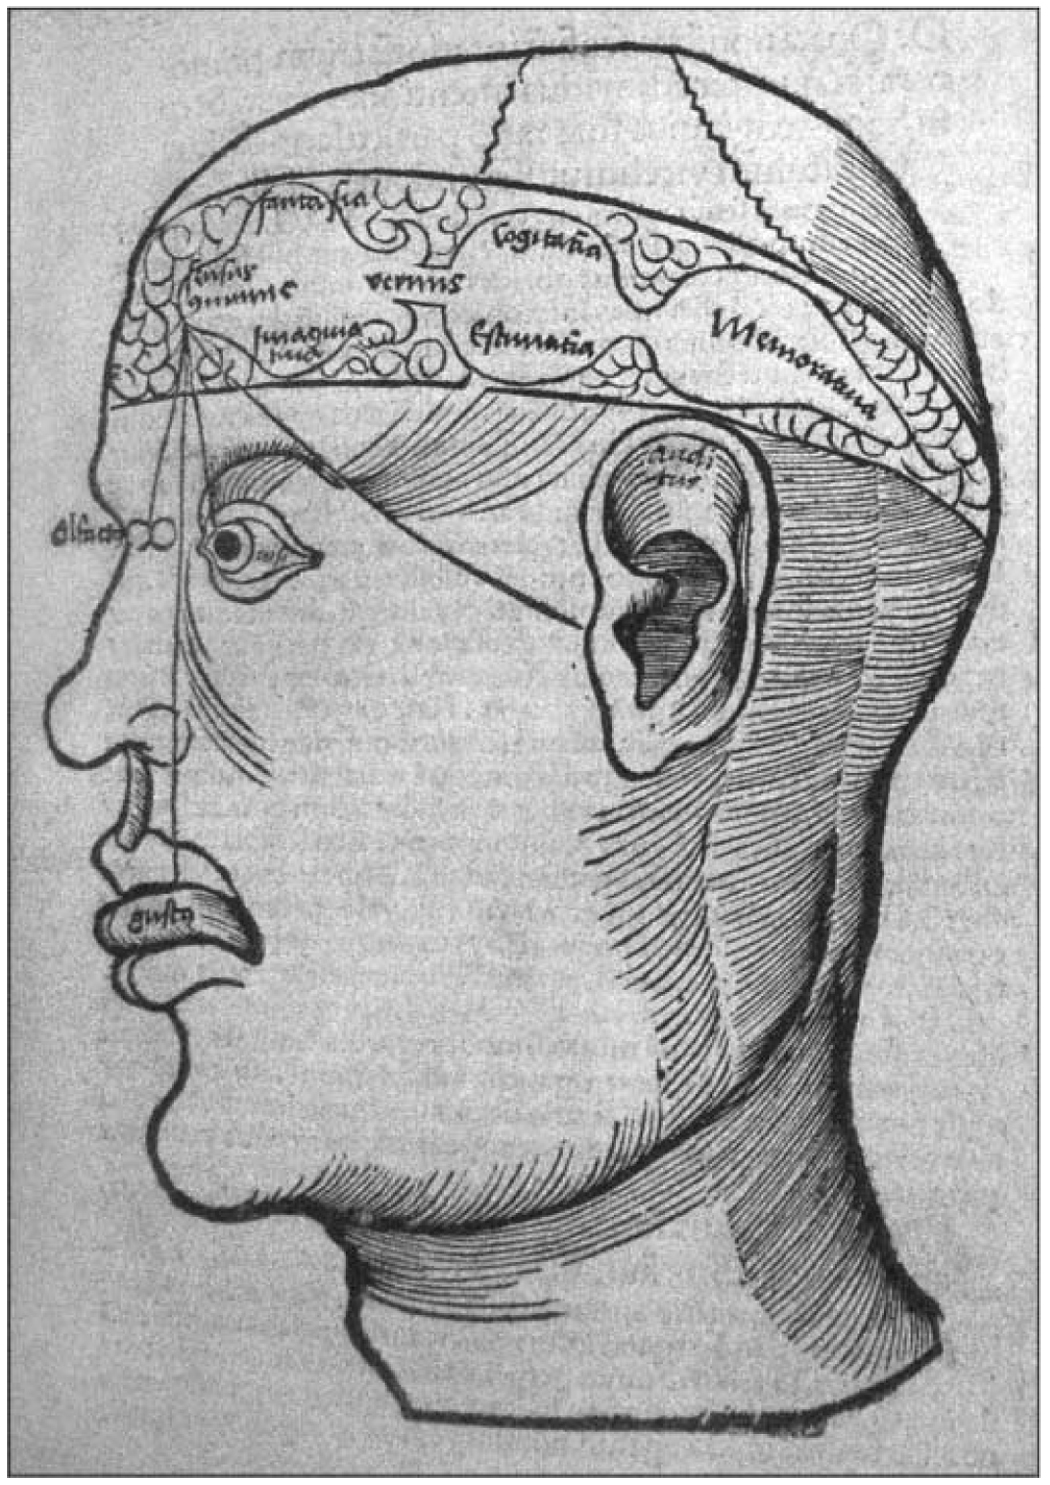
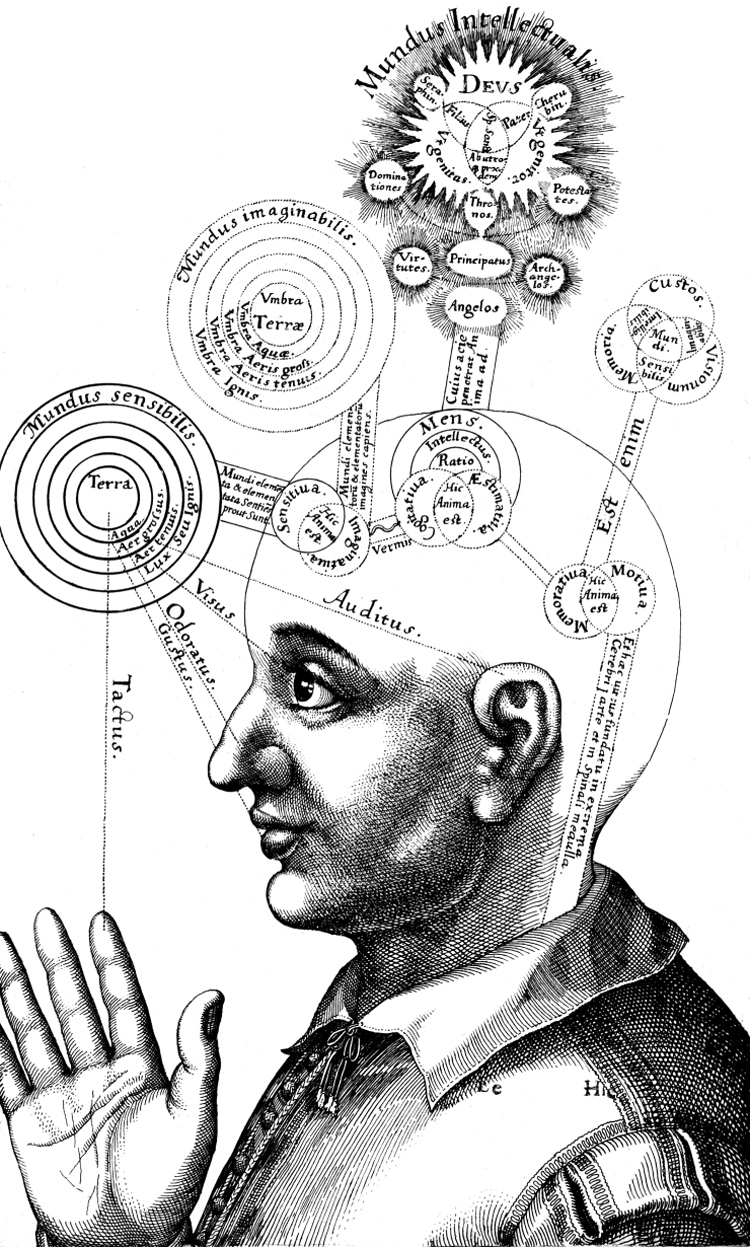
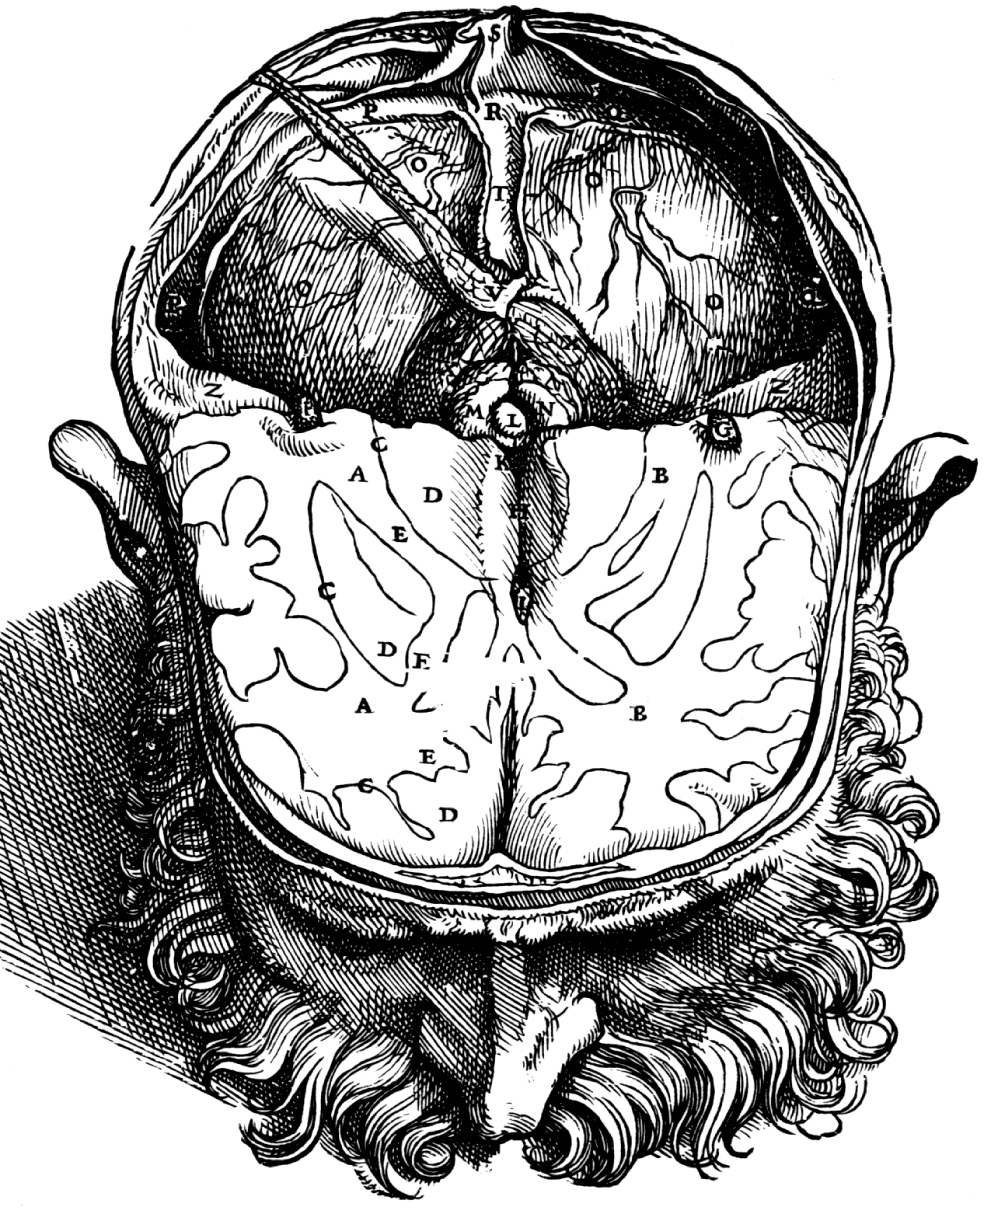
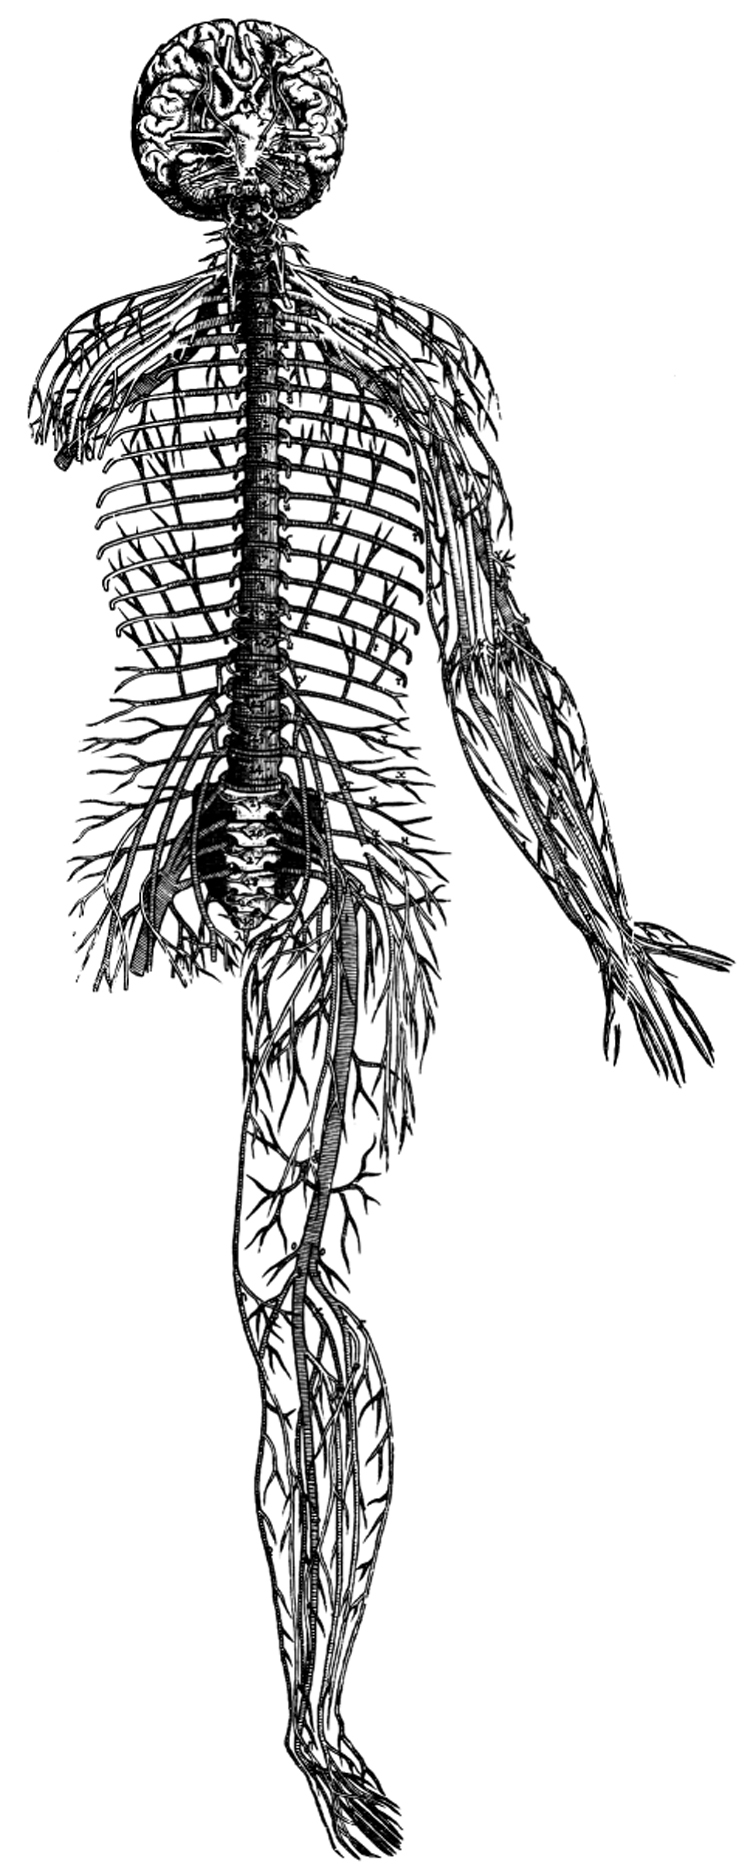
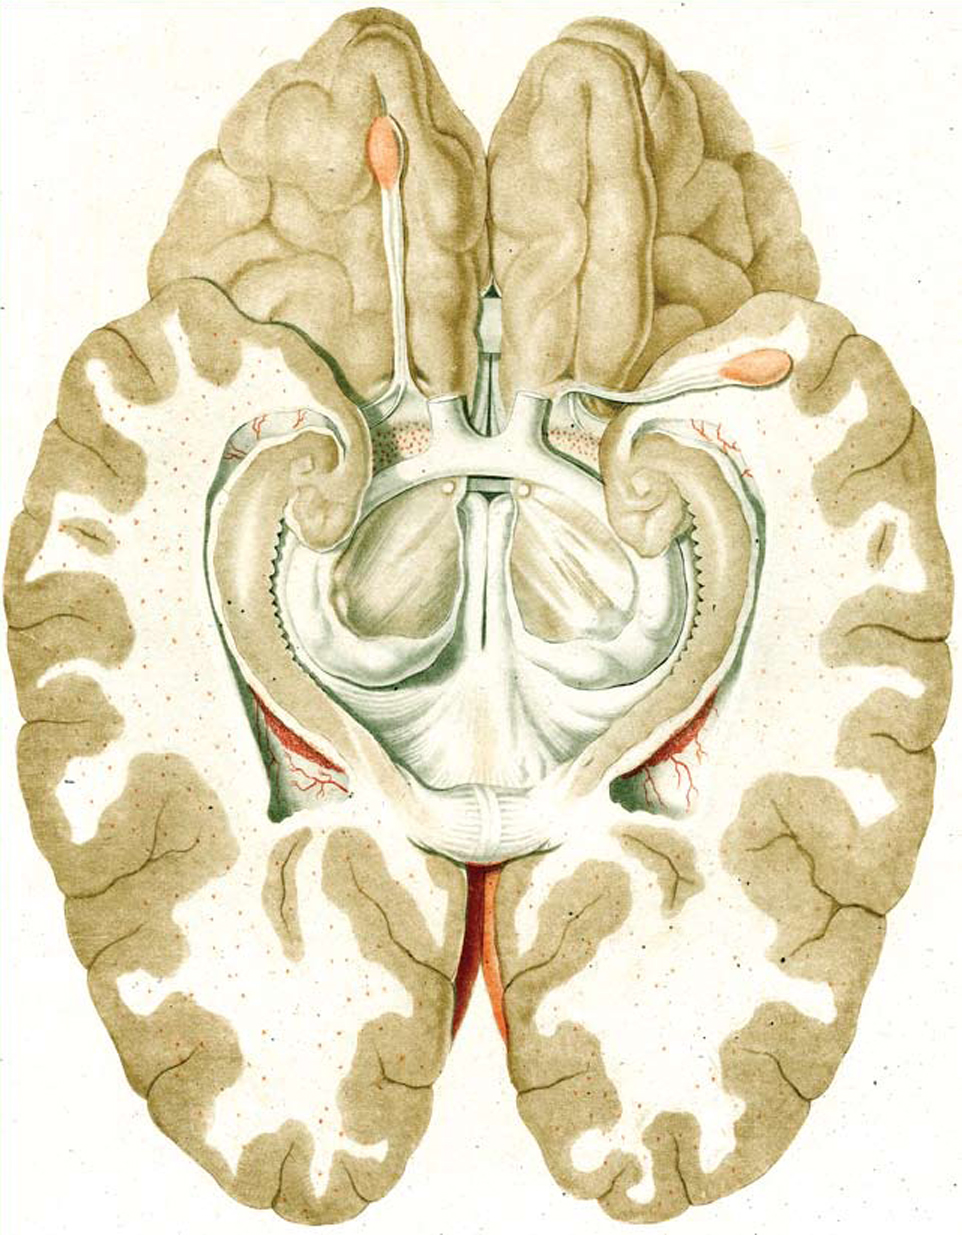
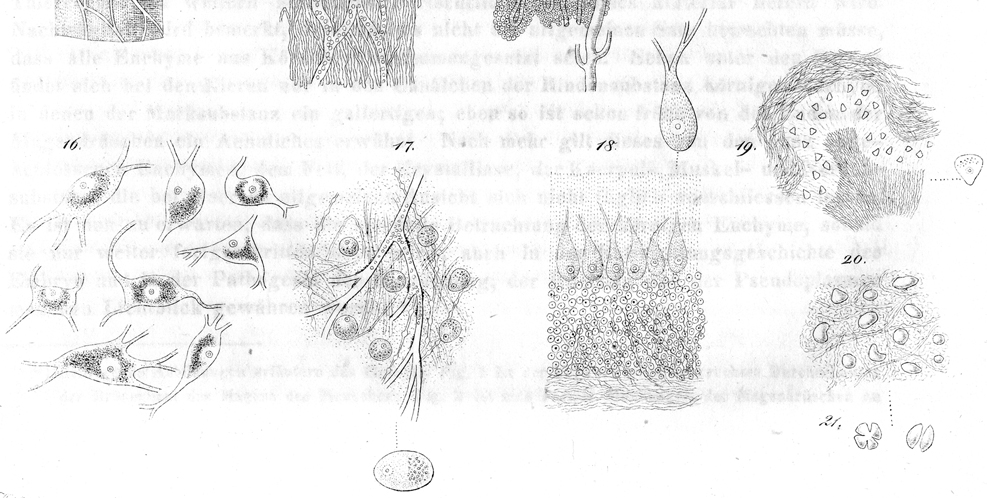
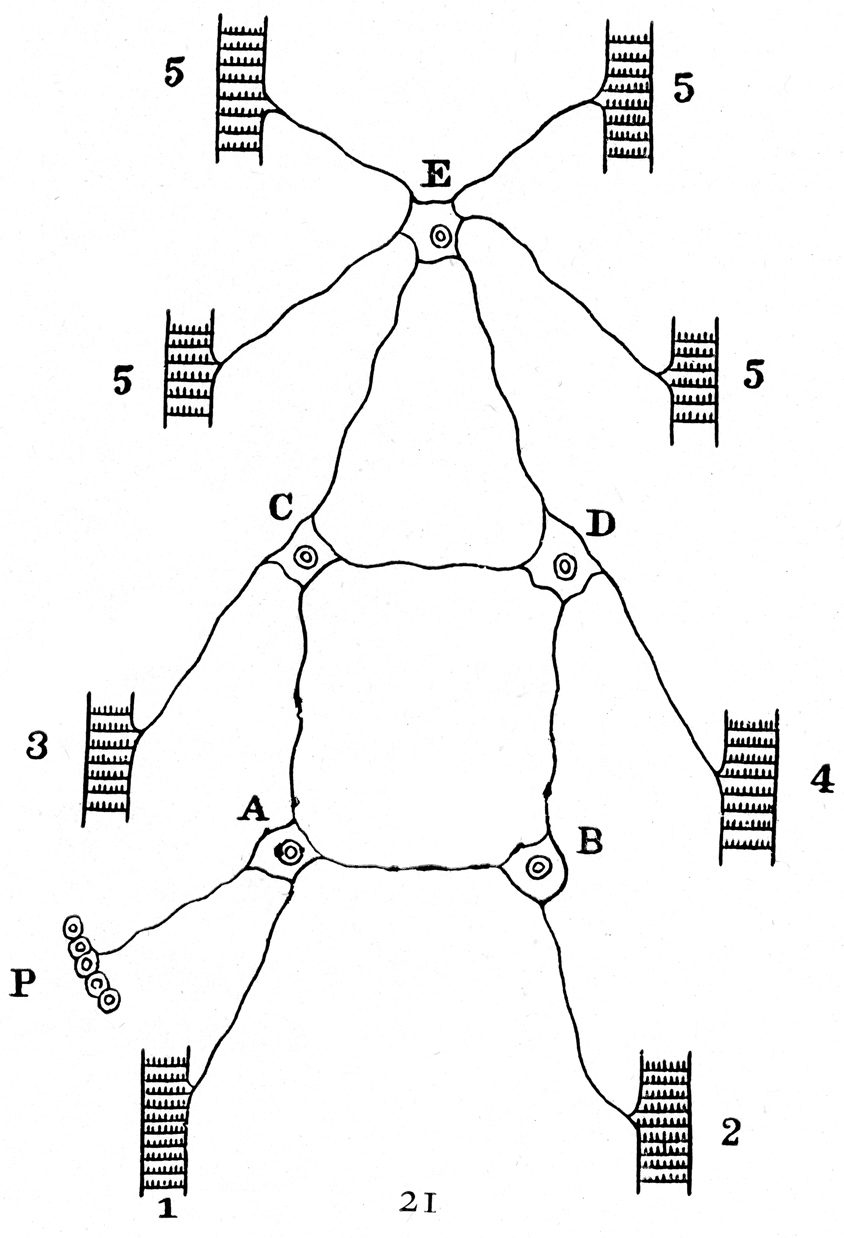
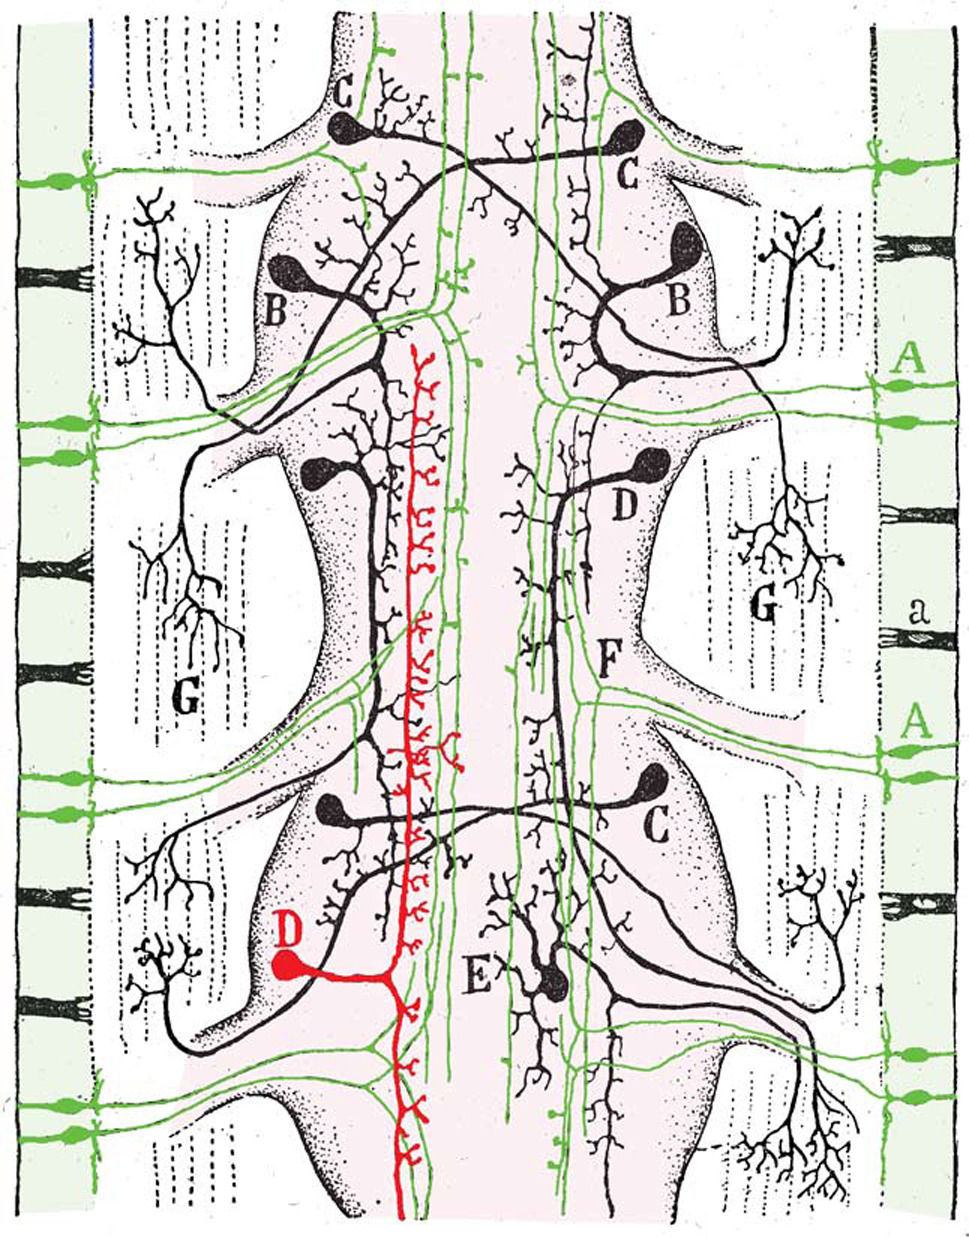
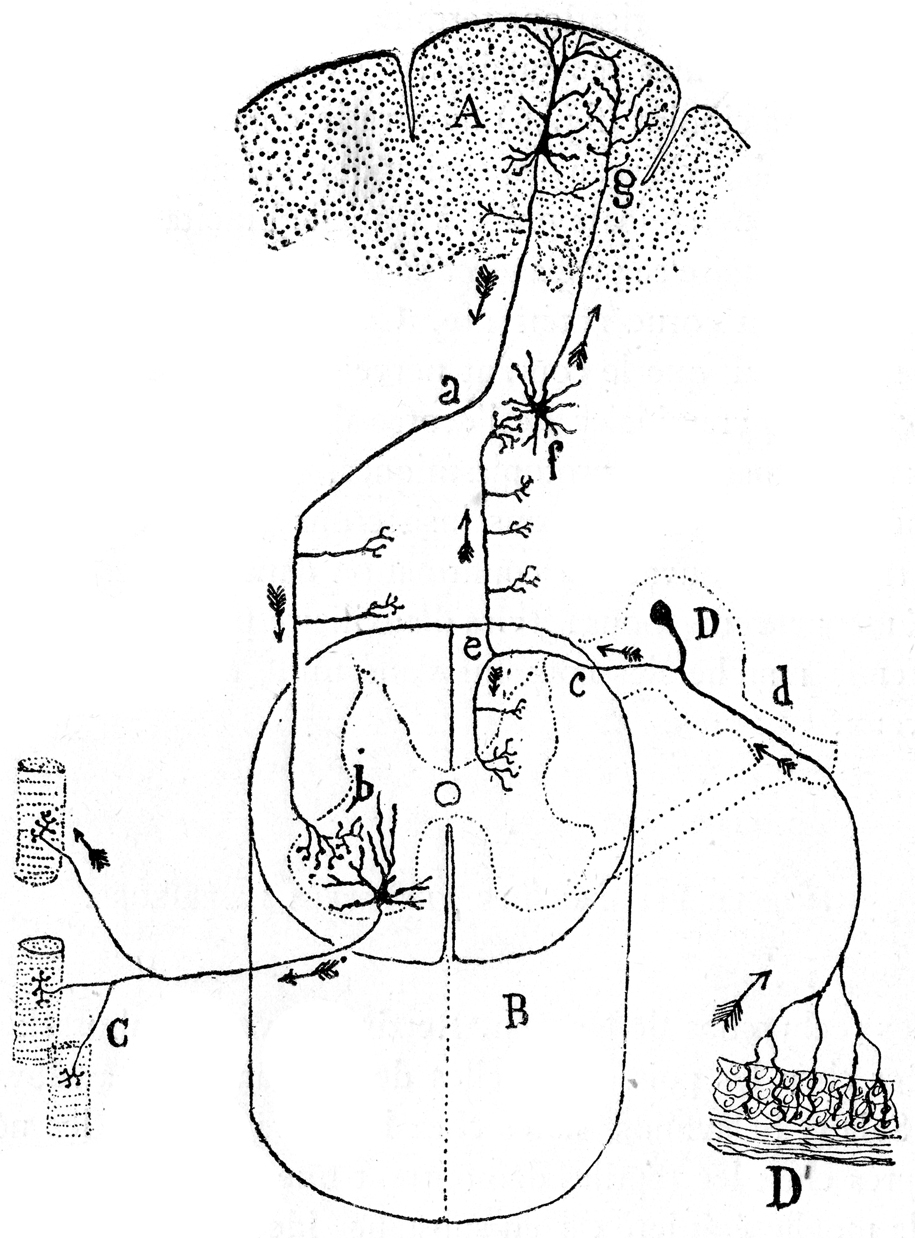
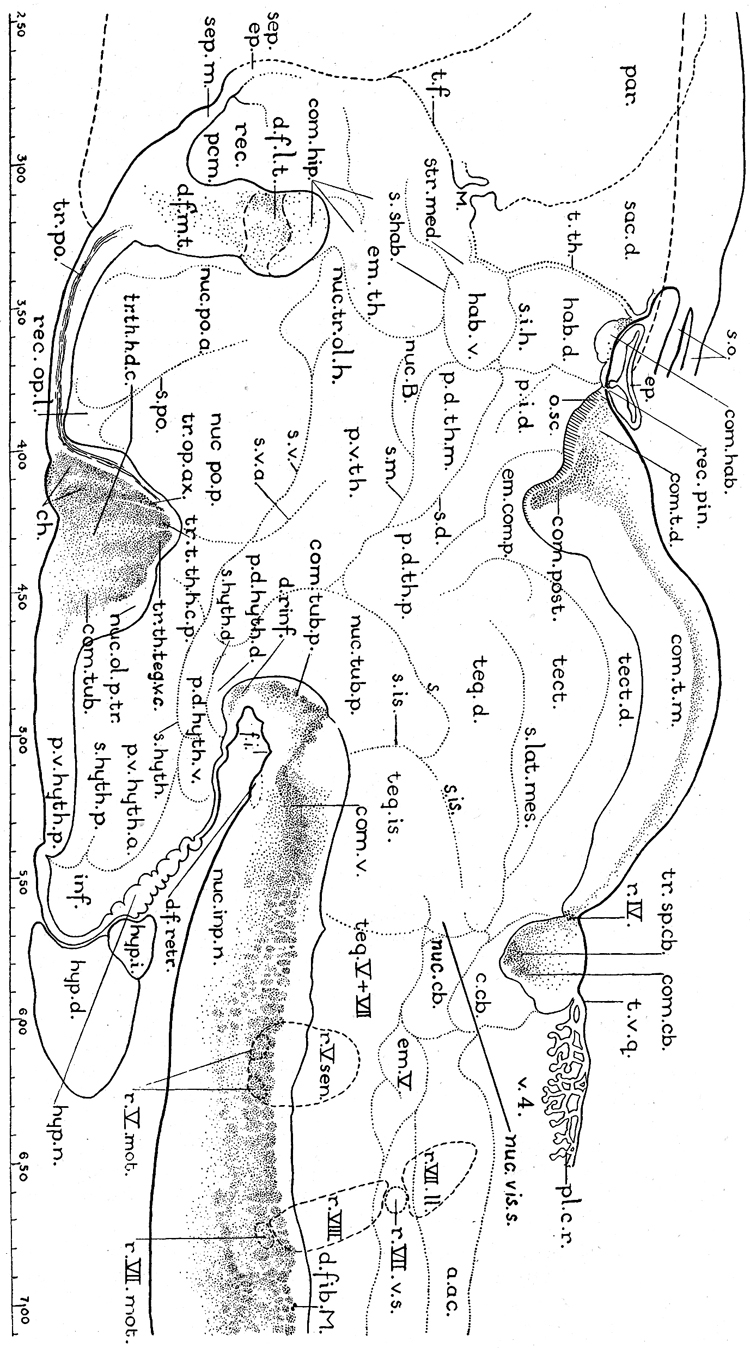
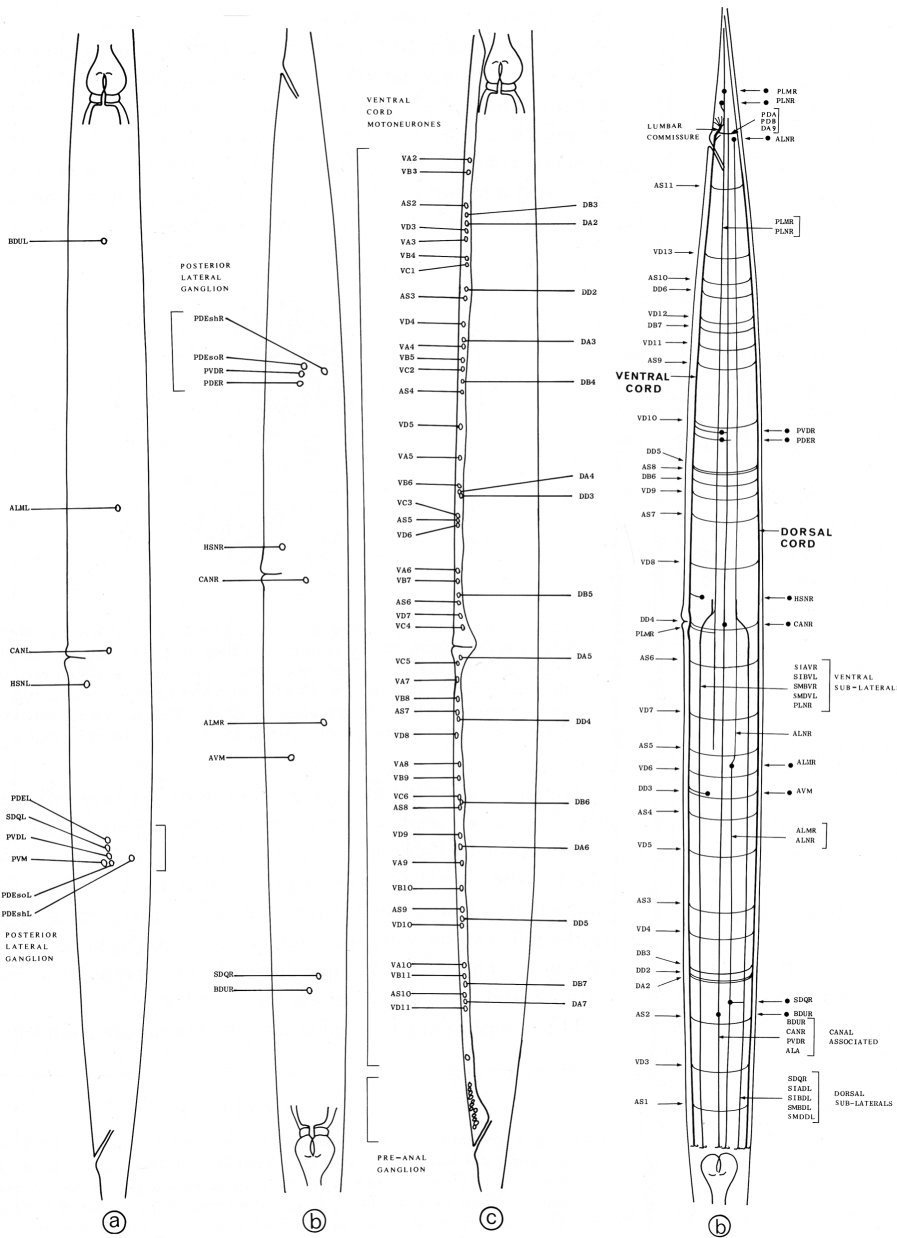
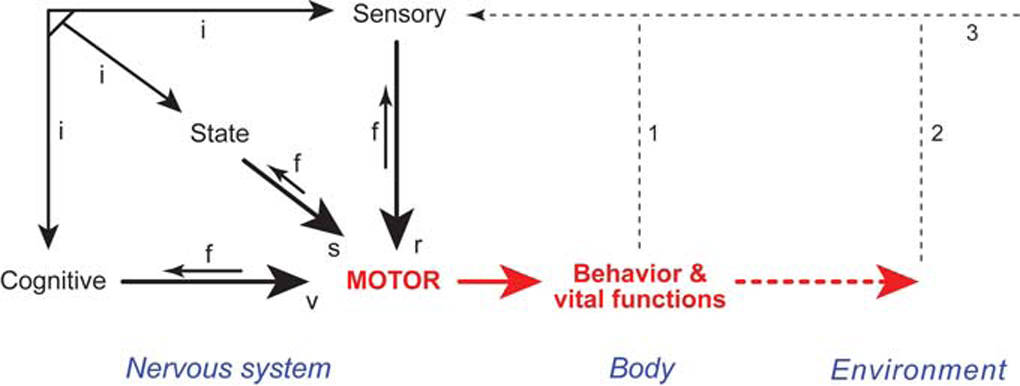
The basic plan of nervous system organization has been investigated since classical antiquity. The first model centered on pneumas pumped from sensory nerves through the ventricular system and out motor nerves to muscles. It was popular well into the 17th century and diverted attention from the organization of brain parenchyma itself. Willis focused on gray matter production and white matter conduction of pneumas in 1664, and by the late 19th century a clear cellular model of nervous system organization based on sensory, motor, and association neuron classes transmitting nerve impulses was elaborated by Cajal and his contemporaries. Today, revolutionary advances in experimental pathway tracing methods, molecular genetics, and computer science inspire systems neuroscience. Seven minimal requirements are outlined for knowledge management systems capable of describing, analyzing, and modeling the basic plan of nervous system circuitry in general, and the plan evolved for vertebrates, for mammals, and ultimately for humans in particular. The goal remains a relatively simple, easy to understand model analogous to the one Harvey elaborated in 1628 for blood circulation in the cardiovascular system. As Cajal wrote in 1909, "To extend our understanding of neural function to the most complex human physiological and psychological activities, it is essential that we first generate a clear and accurate view of the structure of the relevant centers, and of the human brain itself, so that the basic plan--the overview--can be grasped in the blink of an eye."


Figures

Fig. 1
Fig. 1
The first printed rendering of the brain illustrates a then current version of the “three-cell theory” of nervous system function. The first cell or ventricle (I ventriculus) corresponds to our right and left lateral ventricles together. It is regarded the convergence site for the five external senses (Sensus communis or the common sense) and also refines a flavor of psychic pneuma subserving basic imagination (Imaginatio). The second cell or ventricle corresponds to our third ventricle (the hole between the two ventricles represents our interventricular foramen), and its flavors of psychic pneuma subserve the level of cogitation thought to be shared by all animals (Ex[s]timatio) and the creative imagination regarded as unique to humans (Imaginativa). The third cell or ventricle corresponds to our fourth ventricle and its psychic pneuma supports memory and limb movement. The hole between ventricles II and III represents our cerebral aqueduct. From Albertus Magnus (1490), photograph courtesy of the National Library of Medicine.
Fig. 2
Fig. 2
Perhaps the most famous illustration of the three-cell theory of brain functional localization, and the sequential elaboration of cognitive processes leading to behavior (illustrated in Fig. 1). An elongated sagittal “window” on the brain, cut into the skull (note the rather inaccurately placed coronal and lambdoid sutures at the top), reveals schematically the ventricular system, surrounded by what may be rough indications of cerebral gyri, with the olfactory, gustatory, optic, and auditory nerves converging in the rostral end of the anterior (lateral) ventricles. From Gregor Reisch (1504 second edition), photograph courtesy of the UCLA Louise M. Darling Biomedical Library, Department of History and Special Collections.
Fig. 3
Fig. 3
The ultimate illustration of the three-cell theory of brain functional localization, from Fludd (1617–1621). Its debt to earlier work is obvious (see Fig. 1 and Fig. 2), and modern guides to its interpretation can be found in Clarke and Dewhurst (1996) and Manzoni (1998). Photograph courtesy of the National Library of Medicine.
Fig. 4
Fig. 4
An illustration of brain macrostructure from Vesalius’s Fabrica. At this dissection stage (15 were illustrated), the skullcap is removed, the cerebrum cut horizontally, and the occipital lobes removed (top of the figure) to expose the pineal gland (L), tectum (M, N), and dura over the cerebellum (O). In the remaining cerebrum on the figure’s left side the third ventricle; thalamus; posterior and anterior limbs of the internal capsule; globus pallidus, putamen, and caudate nucleus; external capsule and corona radiata; and cerebral cortex are illustrated sequentially, starting near the pineal gland and moving toward the lower left. The only previous indication of a distinction between gray and white matter was in a crude diagram by Dryander (1536, his Fig. 6; see Lind, 1975). Reproduced from the second illustrated edition of the Fabrica (1555).
Fig. 5
Fig. 5
Vesalius’s illustration of the adult human nervous system, as seen from the front, with the brain tilted upward to expose the cranial nerve roots emerging from the base. For practical reasons associated with the dissection, he left the spinal cord within the vertebral column. Most of the features illustrated here were described clearly by Galen thirteen centuries earlier. Reproduced from the 1555 edition of the Fabrica.
Fig. 6
Fig. 6
The macroscopic or gross structure of the human brain was known in considerable detail by the beginning of the nineteenth century. This plate from the work of Felix Vicq d’Azyr (1786) is a view of the human brain from the base, with a horizontal slice removing lower regions of the occipital and temporal lobes to reveal the hippocampus on either side, lying along the medial edge of the lateral ventricle’s inferior horn. Red dots in the white matter indicate blood vessels cut transversely. For orientation also note the optic chiasm between the “heads” of the hippocampi, and the splenium of the corpus callosum (with the longitudinal striae of Lancisi) just caudal to their “tails”. Reproduced from the original.
Fig. 7
Fig. 7
The first general survey of how nerve cell bodies appear in different regions of the brain and spinal cord—their topographic spatial distribution—based on Purkinje’s work and published in 1838. Part 16 shows cell bodies in the substantia nigra, red nucleus, and/or “anterior angle of the fourth ventricle”, Part 17 in the thalamus, Part 18 in the cerebellum, and Part 19 in the inferior olive. Part 20 illustrates “starch-like granules” in the region of the olfactory tubercle, diagonal band nucleus, and/or stria terminalis. The origins of cytoarchitectonics can be traced back directly to this work, especially Fig. 18, where a row of what became known as Purkinje cells are clearly depicted between a relatively cell-free layer above and a layer of tiny (granule) cells below, with a fiber layer at the very bottom. Reproduced from the original at the original size.
Fig. 8
Fig. 8
An illustration of the reticular theory of nerve cell communication in networks, from Landois and Sterling’s Textbook of Human Physiology (1891). Note that processes of nerve cells (A–E) are in direct continuity, even with muscle (5) and sensory regions (P). Thus there are no synapses in the network, and the direction of impulse transmission is indeterminate (compare with Fig. 9). Photograph courtesy of the UCLA Louise M. Darling Biomedical Library, Department of History and Special Collections.
Fig. 9
Fig. 9
The first illustration in Cajal’s Textura del sistema nervioso (1899). It shows in schematic horizontal view the location, shape, and connections of the three basic neuron types found in a generalized worm (compare with Fig. 8). Bipolar sensory neurons (dark green) have their cell body and dendrite in the integument (light green), whereas their axon enters and bifurcates (F) in the ganglionic chain (light red). Crossed (C) and uncrossed (B,D,E) motor neurons (black) have their cell body in the ganglionic chain and generate a process that sends one branch (clearly an axon) to muscle (G) and other branches to various parts of the ganglionic chain. Interganglionic interneurons or association neurons (red D) also have their cell body in the ganglionic chain and generate an axon that remains entirely within the chain. Reproduced from the original; color added.
Fig. 10
Fig. 10
Cajal’s explanation of the simple mammalian reflex arc in terms of the neuron doctrine and functional polarity law (arrows), as well as an illustration of the four basic neuron types he defined (see Section 3.2 and compare with Fig. 9). The peripheral process (d, which he regarded as a dendrite) of a dorsal root sensory ganglion cell (D) begins in the integument (D’), and a central process (c, which he regarded as the axon, for reasons summarized in Chapter 5 of Cajal, 1909) extends into the spinal cord (B) where it bifurcates (e). One bifurcation branch ends on a motoneuron (b) or on a spinal interneuron (unillustrated)—mediating a simple reflex to muscle fibers (C)—whereas the other bifurcation branch ends on an interneuron or association neuron (f) whose axon terminates (g) in the cerebral cortex, influencing a second association neuron that he called a psychomotor or second-order motor neuron (A), whose axon (a) descends to influence also the output of primary motoneurons (b). Reproduced from Cajal (1894).
Fig. 11
Fig. 11
A flatmap of the adult tiger salamander brain, showing regionalization of the gray matter that forms a simple periventricular layer with little or no radial stacking of nuclei or areas through its thickness. Presented vertically with dorsal to the right and rostral at the top, as originally published; the scale at left indicates section number from a serial series cut at 12 µm thickness; right half, with rostral end of cerebral hemisphere cut off. Reproduced with permission of the University of Chicago Press from Herrick (1948).
Fig. 12
Fig. 12
Schematic maps indicating the spatial distribution of all 302 neurons found in adult C. elegans, with the location of all longitudinal and transverse nerve cords. (a, b left, and c) are left-hand, right-hand, and midline views of neuronal cell body locations, respectively, from original Figure 4; (b right) is a right-hand view of major nerve cords from original Figure 7. A separate illustration of each neuron with the distribution of its axon was also published, and is available on the web. Reproduced with permission from White et al. (1986).
Fig. 13
Fig. 13
A four-component global model of vertebrate nervous system organization. This version of the basic plan of nervous system circuitry postulates that behavior is a direct product of motor subsystem activity, which in turn is a function of activity in three other subsystems: sensory, behavioral state, and cognitive. Sensory (afferent) information from the environment (2,3) leads directly to the motor (efferent) system for reflex (r) responses, as well as to the state and cognitive systems. Cognitive information elaborated by the cerebral hemispheres mediates voluntary (v) control of behavior, and there is feedback (f) from the motor subsystem to the sensory, state, and cognitive subsystems. In addition, behavior and vital functions within the body produce feedback (1) through the sensory subsystem, as do the effects of behavior and vital functions on the environment (2). Finally, the sensory, state, and cognitive subsystems are bidirectionally interconnected (i). The result is a chain-like circuit with three sequential parts: environment interactions with body, body interactions with nervous system, and intra-nervous system. All nerves, fiber tracts, and gray matter regions can be localized to one of the four nervous system subsystems (Swanson 2003, 2004, 2005). Adapted from Swanson (2003).
Fig. 14
Fig. 14
A flatmap of the adult rat nervous system. The complete file has all known gray matter differentiations (areas and nuclei) of the central nervous system arranged in a standard way, along with all major fiber tracts and peripheral nerves. Complementary flatmaps of gray matter regionalization have been published for major developmental stages of the rat central nervous system (Alvarez-Bolado and Swanson, 1996) and for the adult human central nervous system (Swanson, 1995). In terms of primary gray matter differentiation, red indicates cerebrum, blue cerebellum, and yellow cerebrospinal trunk. Reproduced with permission from Swanson (2004).
Fig. 15
Fig. 15
A connection matrix for all known gray matter regions (486) of the rat central nervous system, based on the gray matter hierarchical taxonomy of Swanson (1998–1999). The experimentally determined axonal connections displayed were constructed from data in the online Brain Architecture Knowledge Management System, BAMS (Bota et al., 2005; Bota and Swanson, 2006). Projecting regions (from) are on the horizontal axis, receiving regions (to) on the vertical axis. The matrix contains 22,178 cells labeled with a color other than gray (no data), indicating the number of projection reports in the database, representing a coverage factor of 9.4%. No data indicates that either extant literature has not yet been collated or no data exists in the literature. Color code for qualitative projection strength: red, strong; yellow, moderate; blue light; black, none/not detectible. Reproduced with permission from Bota and Swanson (2007).

Similar articles

Cited by

References

    1. Albertus Magnus. Philosophia pauperum sive philosophia naturalis. Brescia: B. Farfengus; 1490.
    1. Alvarez-Bolado G, Swanson LW. Developmental Brain Maps: Structure of the Embryonic Rat Brain. Amsterdam: Elsevier; 1996.
    1. Arbib MA, Grethe JG, editors. Computing the Brain: A Guide to Neuroinformatics. San Diego: Academic Press; 2001.
    1. Björklund A, Hökfelt T, editors. Handbook of Chemical Neuroanatomy. Amsterdam: Elsevier; 1983–2005.
    1. Bota M, Dong H-W, Swanson LW. From gene networks to brain networks. Nature Neurosci. 2003;6:795–799. - PubMed