Comparative Study
. 2007 May;81(9):4819-27.
doi: 10.1128/JVI.02284-06. Epub 2007 Jan 31.

Bluetongue virus entry into cells

Affiliations
Comparative Study

Bluetongue virus entry into cells

Mario Forzan et al. J Virol. 2007 May.

Erratum in

  • J Virol. 2008 Feb;82(3):1626

Abstract

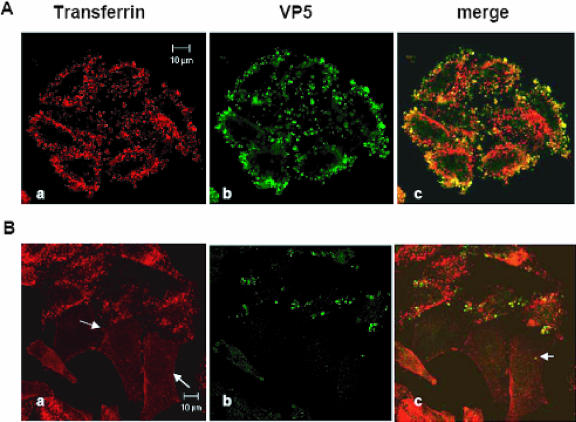
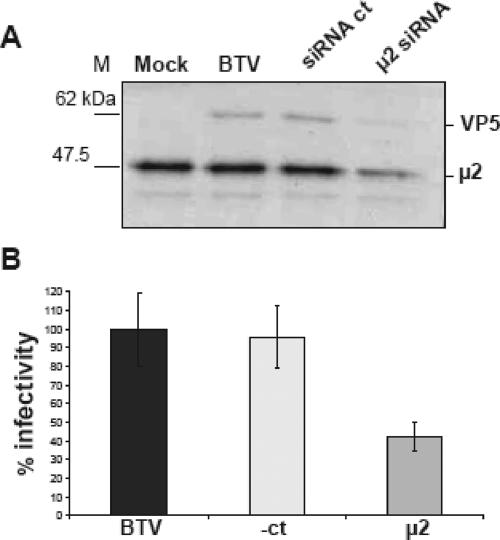
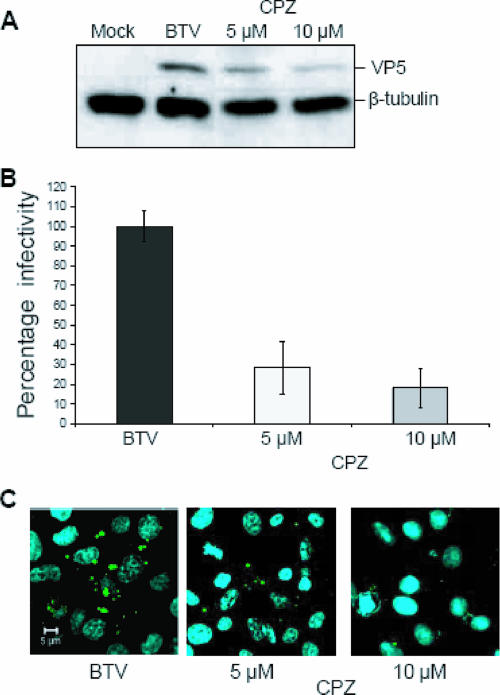
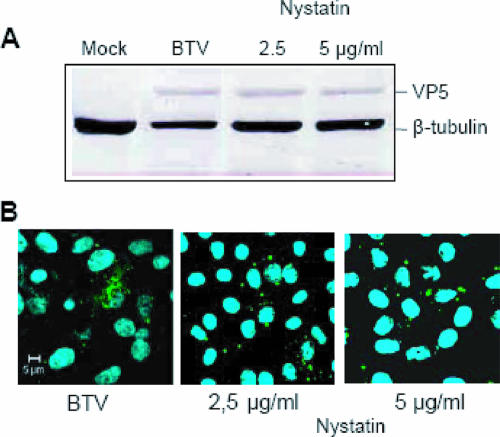
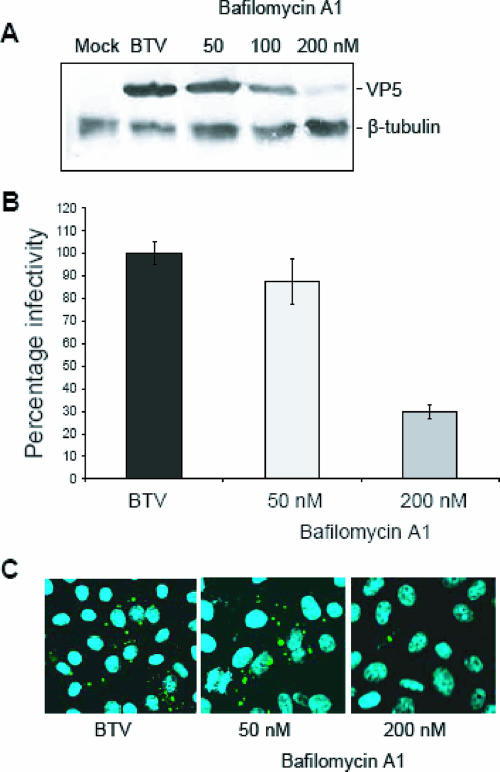
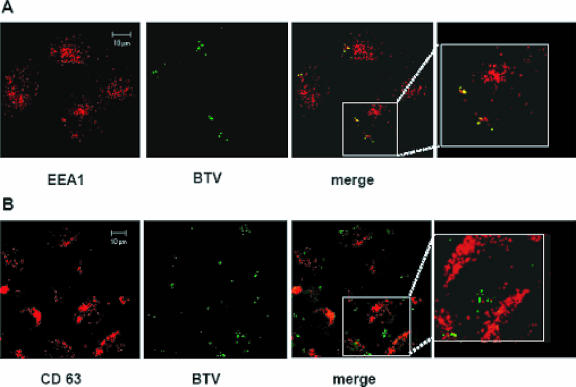
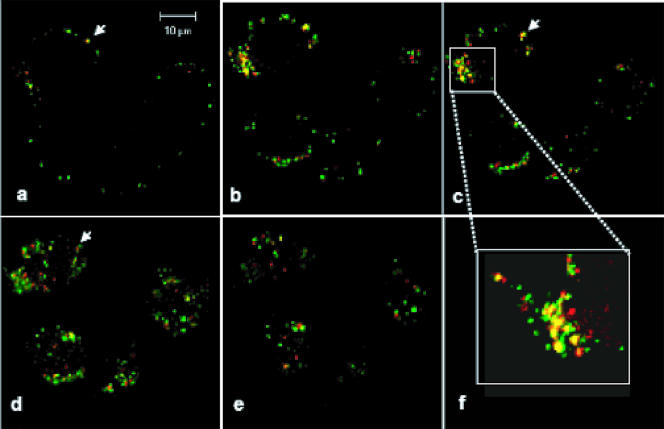
Bluetongue virus (BTV) is a member of the Orbivirus genus within the Reoviridae family. Like those of other members of the family, BTV particles are nonenveloped and contain two distinct capsids, namely, an outer capsid and an inner capsid or core. The two outer capsid proteins, VP2 and VP5, are involved in BTV entry into cells and in the delivery of the transcriptionally active core to the target cell cytoplasm. However, very little is known about the precise mechanism of BTV entry. In this report, using RNA interference, we demonstrate that inhibition of the clathrin-dependent endocytic pathway correlates with reduced BTV internalization and subsequent replication. Furthermore, by using the ATPase inhibitor bafilomycin A1, we show that exposure of the virus to acidic pH is required for productive infection. Moreover, microscopic analysis of cells incubated with BTV indicated that the virus is internalized into early endosomes, where separation of the outer capsid and inner core occurs. Together, our data indicate that BTV undergoes low-pH-induced penetration in early endosomes following clathrin-mediated endocytosis from the plasma membrane, supporting a stepwise model for BTV entry and penetration.


Figures

FIG. 1.
FIG. 1.
BTV entry inhibition by μ2 siRNA. HeLa cells were transfected with the μ2 siRNA for 48 h. Infection was performed as described in Materials and Methods. The effect of the siRNA was investigated by monitoring the cellular uptake of Tf-TRITC by confocal microscopy. BTV particles were stained with a polyclonal anti-VP5 primary antibody and localized with a FITC-conjugated secondary antibody. (A) HeLa cells transfected with the control siRNA, which does not inhibit either Tf uptake (a) or BTV entry (b). (B) Inhibitory effect of μ2 siRNA. In panel a, arrows indicate cells where Tf-TRITC uptake was inhibited, which show no punctate cytoplasmic staining. The arrow in panel c indicates a reduced number of internalized BTV particles in a cell affected by the siRNA.
FIG. 2.
FIG. 2.
Effect of siRNA on BTV replication. Transfection of HeLa cells with the μ2 siRNA was carried out for 36 h. Cells were infected with BTV, using an MOI of 0.5, and incubated for 12 h. Infected cells were harvested and counted, and the same number was loaded in each lane for Western blot analysis. (A) SDS-10% PAGE of infected cells stained with anti-VP5 and anti-μ2 antibodies. (B) Plaque assay analysis. Each sample was tested on BSR cells in triplicate as described in Materials and Methods. Results are presented as percentages, where the plaque number seen for untreated cells is taken as 100%.
FIG. 3.
FIG. 3.
Chemical inhibition of the clathrin pathway. Vero cells were treated with CPZ as specified in Materials and Methods. Cells were infected with BTV and harvested at 24 h p.i. (A) Immunoblotting of CPZ-treated cells was performed as previously described. To verify that the same amount of protein was loaded in each lane, the blots were also stained with an anti-β-tubulin antibody. The intensity of each band was quantified using ImageQuant software (GE Healthcare) and then normalized. (B) Inhibition of BTV infectivity in the presence of 5 and 10 μM of CPZ. Each sample was tested in triplicate. (C) The effect of CPZ was further confirmed by confocal microscopy. At 24 h p.i., cells were stained with a polyclonal anti-VP5 antibody and a FITC-conjugated secondary antibody (green). Nuclei were stained with Hoechst 33258 (blue). Images were collected as indicated in the legend to Fig. 1. Sample identification and final concentrations of the chemical are indicated.
FIG. 4.
FIG. 4.
Abrogation of the caveola pathway does not inhibit BTV replication. Vero cells were incubated with different amounts of nystatin to disrupt the caveola pathway. (A) Western blotting of cells infected with BTV after nystatin treatment. The intensity of each band was quantified using ImageQuant software and then normalized. (B) Confocal microscopy to confirm the above results was performed as described in the legend to Fig. 3. Sample identification and final concentrations of the drug are indicated.
FIG. 5.
FIG. 5.
Inhibition of endosomal acidification. The dependence of BTV entry on low pH was analyzed using increasing concentrations of BAF. Pretreated Vero cells were infected using an MOI of 1 and harvested after 24 h. (A) Cell lysates were analyzed by Western blotting using anti-VP5 and anti-β-tubulin antibodies. (B) Plaque assay of samples collected from BTV infection in the presence of BAF. (C) Confocal microscopy of infected Vero cells was performed as described in the legend to Fig. 3. Sample identification and final concentrations of BAF are indicated.
FIG. 6.
FIG. 6.
BTV localization in endosomal compartments. HeLa cells were infected and prepared for confocal microscopy as described in Materials and Methods. Early and late endosomes were detected using (A) monoclonal anti-EEA1 and (B) monoclonal anti-CD63 antibodies. A TRITC-conjugated antibody was used as the secondary antibody in both cases (red). BTV-infected cells were stained using a polyclonal anti-VP5 antiserum and a FITC-conjugated secondary antibody (green). The displayed pictures represent cells in which the infection was carried out for 30 min. A detailed image of each merged sample is shown in the last panel.
FIG. 7.
FIG. 7.
Separation between outer capsid and core. HeLa cells were infected using an MOI of 10. Samples were harvested at 15 min p.i. and processed for confocal microscopy. The outer capsid protein VP5 was stained with a polyclonal primary antiserum and a secondary FITC-conjugated antibody (green). The core protein VP7 was labeled with a monoclonal antibody and a TRITC-conjugated secondary antibody (red). Pictures represent a continuous z-stack imaging process, with a stack size of 8 μm and a scale between cellular layers of 1 μm. Images progress from the top of the cell (a) through the middle sections (b to e). Arrows indicate a specific area in which VP5 and VP7 initially colocalized (a) and then separated (d). Panel f shows a detailed view of the localization of the two proteins.

References

    1. Blanchard, E., S. Belouzard, L. Goueslain, T. Wakita, J. Dubuisson, C. Wychowski, and Y. Rouille. 2006. Hepatitis C virus entry depends on clathrin-mediated endocytosis. J. Virol. 80:6964-6972. - PMC - PubMed
    1. Brezis, M., S. Rosen, P. Silva, K. Spokes, and F. H. Epstein. 1984. Polyene toxicity in renal medulla: injury mediated by transport activity. Science 224:66-68. - PubMed
    1. Chandran, K., and M. L. Nibert. 2003. Animal cell invasion by a large nonenveloped virus: reovirus delivers the goods. Trends Microbiol. 11:374-382. - PubMed
    1. Chemello, M. E., O. C. Aristimuno, F. Michelangeli, and M. C. Ruiz. 2002. Requirement for vacuolar H+-ATPase activity and Ca2+ gradient during entry of rotavirus into MA104 cells. J. Virol. 76:13083-13087. - PMC - PubMed
    1. Conner, S. D., and S. L. Schmid. 2003. Regulated portals of entry into the cell. Nature 422:37-44. - PubMed

Publication types

LinkOut - more resources