. 2007 Apr;81(8):3877-90.
doi: 10.1128/JVI.02725-06. Epub 2007 Jan 31.

Downregulation of CD4 by human immunodeficiency virus type 1 Nef is dependent on clathrin and involves direct interaction of Nef with the AP2 clathrin adaptor

Affiliations

Downregulation of CD4 by human immunodeficiency virus type 1 Nef is dependent on clathrin and involves direct interaction of Nef with the AP2 clathrin adaptor

Rittik Chaudhuri et al. J Virol. 2007 Apr.

Abstract

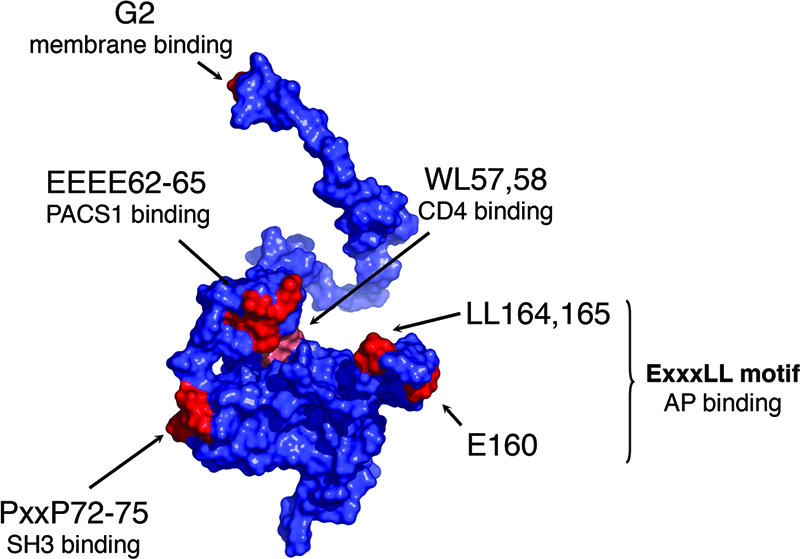
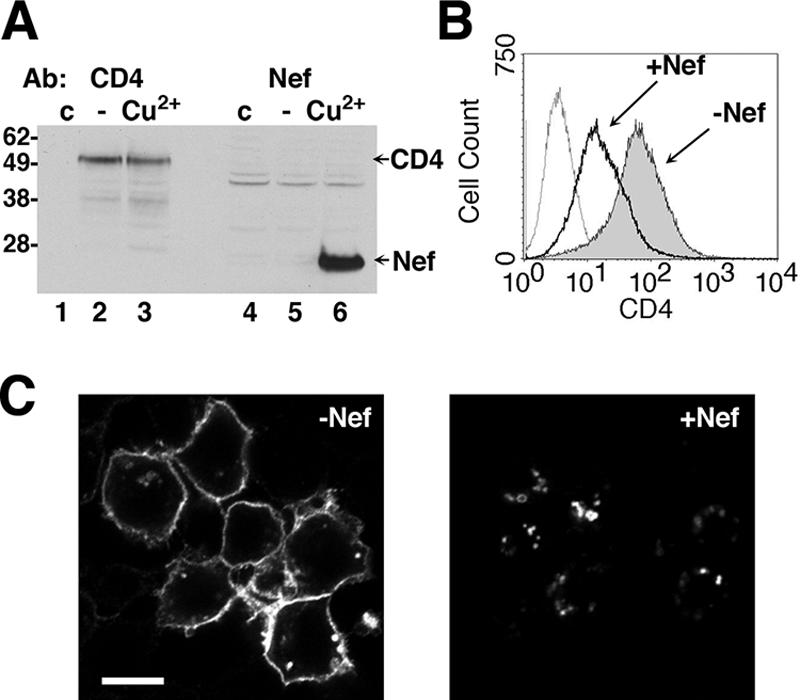
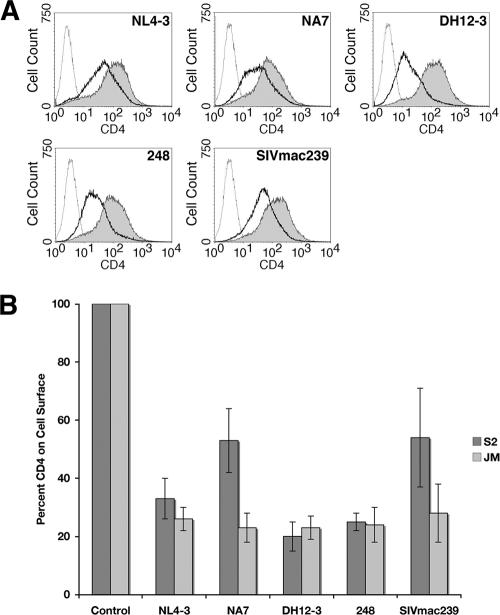
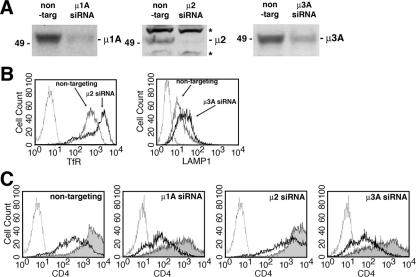
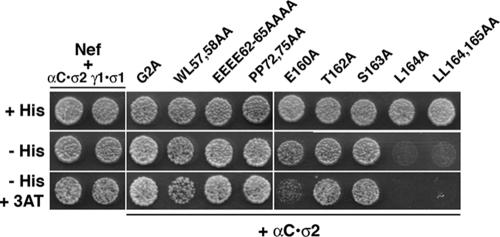
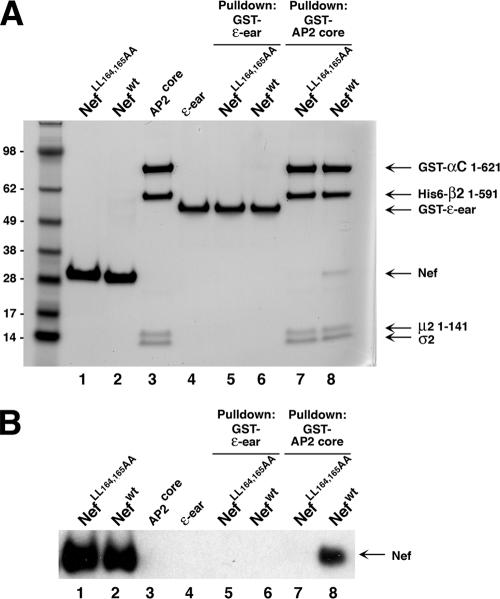
Nef, an accessory protein of human and simian immunodeficiency viruses, is a critical determinant of pathogenesis that promotes the progression from infection to AIDS. The pathogenic effects of Nef are in large part dependent on its ability to downregulate the macrophage and T-cell coreceptor, CD4. It has been proposed that Nef induces downregulation by linking the cytosolic tail of CD4 to components of the host-cell protein trafficking machinery. To identify these components, we developed a novel Nef-CD4 downregulation system in Drosophila melanogaster S2 cells. We found that human immunodeficiency virus type 1 (HIV-1) Nef downregulates human CD4 in S2 cells and that this process is subject to the same sequence requirements as in human cells. An RNA interference screen targeting protein trafficking genes in S2 cells revealed a requirement for clathrin and the clathrin-associated, plasma membrane-localized AP2 complex in the downregulation of CD4. The requirement for AP2 was confirmed in the human cell line HeLa. We also used a yeast three-hybrid system and glutathione S-transferase pull-down analyses to demonstrate a robust, direct interaction between HIV-1 Nef and AP2. This interaction requires a dileucine motif in Nef that is also essential for downregulation of CD4. Together, these results support a model in which HIV-1 Nef downregulates CD4 by promoting its accelerated endocytosis by a clathrin/AP2 pathway.


Figures

FIG. 1.
FIG. 1.
(A) Surface representation of the three-dimensional structure of HIV-1 Nef. The representation is a composite assembled from two reported nuclear magnetic resonance structures (accession codes 1QA5 and 2NEF) with an additional loop region (residues 159 to 173) modeled and drawn by using PyMOL (20). Residues that are relevant to the present study are indicated in red. Residues are numbered according to the NL4-3 Nef sequence.
FIG. 2.
FIG. 2.
Downregulation of human CD4 by HIV-1 Nef in Drosophila S2 cells. (A) Immunoblot analysis of S2 cells 48 h after transient transfection with pAc.CD4 and pMt.Nef and 24 h after induction of Nef expression with CuSO4. Lysates from an untransfected control (lanes 1 and 4) and doubly transfected cells either without (lanes 2 and 5) or with (lanes 3 and 6) induction were analyzed by immunoblotting with antibodies to CD4 and Nef. The positions of molecular mass markers (in kilodaltons) are shown on the left. (B) S2 cells were transiently transfected with pAc.CD4 and pMt.Nef, incubated without (shaded gray) or with (bold line) CuSO4, and stained with a mouse monoclonal antibody to human CD4 and PE-conjugated anti-mouse IgG. Untransfected cells were also stained as a negative control (dotted line). Cells were analyzed by FACS. The x axis represents CD4 fluorescence on a logarithmic scale, and the y axis represents the number of cells on a linear scale. (C) Immunofluorescence microscopy of CD4 in S2 cells. The cells were transiently transfected with pAc.CD4 and pMt. Nef, incubated for 24 h, and either left untreated (i.e., −Nef) or treated with CuSO4 (i.e., +Nef) for another 24 h, fixed, permeabilized, and stained with mouse monoclonal antibody to human CD4 and AlexaFluor 594-conjugated donkey antibody to mouse IgG. Stained cells were examined by confocal microscopy. Bar, 5 μm.
FIG. 3.
FIG. 3.
Comparison of the downregulation of CD4 by Nef from various HIV-1 and SIV variants in Drosophila S2 and human JM CD4+ T cells. (A) FACS histograms of Drosophila S2 cells that were doubly transfected with pAc.CD4 and pMt vectors encoding a variety of HIV-1 (NL4-3, NA7, DH12-3, and 248) and SIV Nef (mac239) alleles, incubated without (shaded gray) or with CuSO4 (bold line), and stained with a mouse monoclonal antibody to human CD4 and PE-conjugated anti-mouse IgG. Uninduced control cells were also stained with an isotype antibody control and PE anti-mouse IgG (dotted line). (B) Bar graph depicting levels of cell surface CD4 in Drosophila S2 cells cotransfected with pAc.CD4 and pMt.Nef (various HIV-1 and SIV alleles) (dark gray) and in human JM CD4+ cells transfected with pNef.IRES.GFP (various HIV-1 and SIV alleles) (light gray). Induction of Nef expression and FACS analysis were performed as described in Materials and Methods. For S2 cells the control represents uninduced cells transfected with NL4-3 Nef. For JM cells, the control represents cells transfected with empty vector, pIRES2-eGFP. In order to compare between experiments, CD4 surface levels were represented as a percentage of the control condition. Values are the mean relative CD4 surface level percentage ± the standard error of the mean (SEM) from three independent experiments.
FIG. 4.
FIG. 4.
Determinants of Nef-induced CD4 downregulation in Drosophila S2 and human JM CD4+ T cells. (A) FACS histograms of Drosophila S2 cells cotransfected with pAc.CD4 (wild-type or LL413,414AA mutant) and pMt.Nef (wild-type or various mutants). FACS analysis of uninduced (shaded gray), induced (bold line), and background fluorescence (dotted line) was performed as described in the legend to Fig. 2 and in Materials and Methods. (B) Bar graph depicting levels of cell surface CD4 in Drosophila S2 cells cotransfected with pAc.CD4 and pMt.Nef (wild type or various mutants) (dark gray) and in human CD4+ JM cells transfected with pIRES.Nef.GFP (wild type or mutants) (light gray). In this case the control represents relative CD4 surface levels in the presence of the empty vector pIRES2-eGFP. Induction of Nef expression and FACS analysis were performed as described in Materials and Methods. CD4 surface levels were calculated as described in the legend to Fig. 3. Values are the mean ± the SEM from three independent experiments.
FIG. 5.
FIG. 5.
Immunofluorescence microscopy of CD4 in S2 cells. Cells were transiently transfected with pAc.CD4 and pMt.NL4-3 Nef (wild type or the indicated mutant), incubated for 24 h, and left untreated (C, E, G, I, and K) or treated with CuSO4 (D, F, H, J, and L) for another 24 h, fixed, permeabilized, and stained with mouse monoclonal antibody to human CD4 and AlexaFluor 594-conjugated donkey antibody to mouse IgG. Untransfected cells treated in a similar fashion (A and B) were also stained as a control for antibody specificity. Stained cells were examined by confocal microscopy. Bar, 10 μm.
FIG. 6.
FIG. 6.
Effect of selected RNAi treatments on Nef-induced CD4 downregulation in stably transfected S2 cells. (A) CD4 expression profiles of S2 cells stably expressing CD4 and Nef, after treatment with dsRNAs targeting GFP (nontargeting control), CD4 (no CD4 expression control), and Nef (no downregulation control). (B) CD4 expression profiles of S2 cells stably expressing CD4 and Nef, after treatment with dsRNAs targeting the clathrin subunits CHC and CLC; α-COP; AP complex subunits μ1, μ2, and μ3; and GGA. In each case, a portion of the S2 cells treated with dsRNAs were induced with CuSO4 for 24 h, whereas the remainder were left untreated. CD4 surface expression was measured by FACS as described in the legend to Fig. 2 and in Materials and Methods, with the exception that an isotype control antibody was used to stain the cells as a negative antibody control. (C) Immunoblot analysis of lysates from S2 cells transiently transfected with V5-epitope-tagged Drosophila genes (μ1, μ2, μ3, GGA, and CLC). After transfection, each group of cells was seeded into two culture wells and received dsRNA targeting either GFP (negative control; lanes 1, 3, 5, 7, and 9) or the specific transgene (lanes 2, 4, 6, 8, and 10). Lysates were subjected to SDS-PAGE and probed with anti-V5 monoclonal antibody. The positions of molecular mass markers (in kilodaltons) are shown on the left.
FIG. 7.
FIG. 7.
Results of the RNAi screen of 68 components of the protein trafficking machinery for their involvement in Nef-induced CD4 downregulation in S2 cells. Mean ± the SEM (n = 2 to 10) CD4 levels of cells treated with dsRNAs targeting 68 candidate and control genes (see Table 1), represented on an x-y plot. Each datum point represents surface CD4 levels, as measured by FACS, for cells treated with a particular dsRNA. The position on the x axis indicates the amount of CD4 on the cell surface without induction, while the position on the y axis indicates the amount of CD4 on the cell surface upon induction of Nef expression, in relative fluorescence units (rfu). According to this rubric, datum points that have the same amount of CD4 expression without or with induction of Nef expression indicate dsRNAs that completely inhibited the ability of Nef to downregulate CD4. A least-squares fit regression line (solid black line) for the entire data set with a 95% confidence interval (broken lines) and the line y = x (gray line) indicating the position of no downregulation have been added to the plot.
FIG. 8.
FIG. 8.
Analysis of AP2 knockdown in human cells. HeLa cells were treated with either nontargeting or specific RNAi oligonucleotide duplexes targeting μ1A, μ2, or μ3A as described in Materials and Methods. After 6 days of treatment, the cells were transfected with expression vectors for CD4 and either pNL4-3 Nef.IRES.GFP (wild-type) or the inactive LL164,165AA mutant. (A) Immunoblotting of RNAi-treated HeLa cell lysates using rabbit antisera to human μ1A, μ2, or μ3A. Two nonspecific bands on the μ2 blot are indicated by asterisks. The specific band migrates at ∼50 kDa and is drastically reduced in the RNAi-treated cells. (B) Surface TfR or LAMP1 were measured by FACS as a functional indicator of impaired AP2 or AP3 function, respectively. The μ2 RNAi-treated cells exhibit a strong increase in TfR, a finding consistent with a decrease in AP2-dependent endocytosis. The increase in surface LAMP1 in the μ3 RNAi-treated cells is indicative of improper AP3-dependent intracellular sorting. (C) Dependence of Nef-mediated CD4 downregulation on AP2. HeLa cells transfected as described above and processed for FACS in order to detect CD4 surface levels; in each case GFP fluorescence was used as a marker for cells that had been transfected with the Nef expression vector. Histograms for cells transfected with NefLL164,165AA (shaded gray), wild-type Nef (bold line), and an isotype control (dotted line) are presented. Nontargeting, μ1A, and μ3A RNAi-treated cells exhibit a decrease in surface CD4 in the presence of Nef. In the μ2 RNAi-treated cells this decrease is less marked.
FIG. 9.
FIG. 9.
Yeast three-hybrid analysis of Nef-AP2 interactions. GAL4BD-Nef and the σ1 or σ2 subunits of AP1 and AP2, respectively, were expressed from pBridge; γ1 and αC were expressed as fusions with GAL4AD from pGADT7. Yeast strains coexpressing Nef (wild-type NL4-3 variant or selected mutants) with either γ1-σ1 or αC-σ2 hemicomplexes were inoculated on agar plates made with medium with (+) or without (−) histidine (His) and in the absence or presence of 3 mM 3-aminotriazole (3AT). Growth indicates the occurrence of interactions.
FIG. 10.
FIG. 10.
Direct interaction of Nef and AP2 detected in vitro. Purified recombinant proteins were prepared as described in Materials and Methods, subjected to a GST pull-down assay and SDS-PAGE, and stained with Coomassie blue (A) and immunoblotted with Nef antibody (B). Recombinant proteins were run individually in lane 1 (Nef LL164,165AA), lane 2 (wild-type NL4-3 Nef), lane 3 (GST-AP2core), and lane 4 (GST-ɛ-ear). Recombinant Nef proteins were incubated with GST-ɛ-ear (lanes 5 and 6) (control) or with GST-AP2core (lanes 7 and 8). Wild-type Nef is visible as a 27-kDa band in lane 8 in both panels A and B. This experiment is representative of three experiments with similar results. Molecular mass markers are visible on the left side of the Coomassie blue-stained gel. The masses in kilodaltons are indicated.

Similar articles

Cited by

References

    1. Agaisse, H., L. S. Burrack, J. A. Philips, E. J. Rubin, N. Perrimon, and D. E. Higgins. 2005. Genome-wide RNAi screen for host factors required for intracellular bacterial infection. Science 309:1248-1251. - PubMed
    1. Aiken, C., J. Konner, N. R. Landau, M. E. Lenburg, and D. Trono. 1994. Nef induces CD4 endocytosis: requirement for a critical dileucine motif in the membrane-proximal CD4 cytoplasmic domain. Cell 76:853-864. - PubMed
    1. Anderson, S. J., M. Lenburg, N. R. Landau, and J. V. Garcia. 1994. The cytoplasmic domain of CD4 is sufficient for its down-regulation from the cell surface by human immunodeficiency virus type 1 Nef. J. Virol. 68:3092-3101. - PMC - PubMed
    1. Benichou, S., M. Bomsel, M. Bodeus, H. Durand, M. Doute, F. Letourneur, J. Camonis, and R. Benarous. 1994. Physical interaction of the HIV-1 Nef protein with beta-COP, a component of non-clathrin-coated vesicles essential for membrane traffic. J. Biol. Chem. 269:30073-30076. - PubMed
    1. Benson, R. E., A. Sanfridson, J. S. Ottinger, C. Doyle, and B. R. Cullen. 1993. Downregulation of cell-surface CD4 expression by simian immunodeficiency virus Nef prevents viral super infection. J. Exp. Med. 177:1561-1566. - PMC - PubMed

Publication types

Substances

LinkOut - more resources