Comparative Study
. 2007 Jan 31;27(5):993-1005.
doi: 10.1523/JNEUROSCI.3948-06.2007.

P2Y1 receptor modulation of the pre-Bötzinger complex inspiratory rhythm generating network in vitro

Affiliations
Comparative Study

P2Y1 receptor modulation of the pre-Bötzinger complex inspiratory rhythm generating network in vitro

Amanda R Lorier et al. J Neurosci. .

Abstract

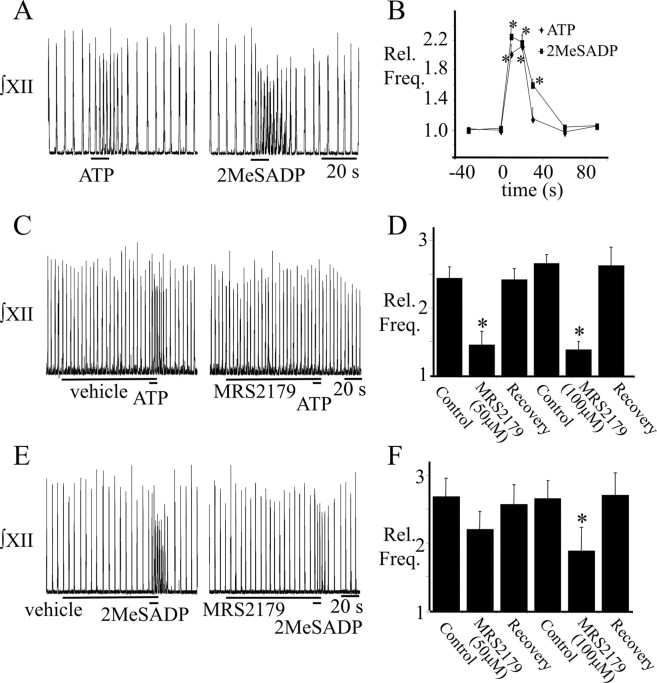
ATP is released during hypoxia from the ventrolateral medulla (VLM) and activates purinergic P2 receptors (P2Rs) at unknown loci to offset the secondary hypoxic depression of breathing. In this study, we used rhythmically active medullary slices from neonatal rat to map, in relation to anatomical and molecular markers of the pre-Bötzinger complex (preBötC) (a proposed site of rhythm generation), the effects of ATP on respiratory rhythm and identify the P2R subtypes responsible for these actions. Unilateral microinjections of ATP in a three-dimensional grid within the VLM revealed a "hotspot" where ATP (0.1 mM) evoked a rapid 2.2 +/- 0.1-fold increase in inspiratory frequency followed by a brief reduction to 0.83 +/- 0.02 of baseline. The hotspot was identified as the preBötC based on histology, overlap of injection sites with NK1R immunolabeling, and potentiation or inhibition of respiratory frequency by SP ([Sar9-Met(O2)11]-substance P) or DAMGO ([D-Ala2,N-MePhe4,Gly-ol5]-enkephalin), respectively. The relative potency of P2R agonists [2MeSADP (2-methylthioadenosine 5'-diphosphate) approximately = 2MeSATP (2-methylthioadenosine 5'-triphosphate) approximately = ATPgammas (adenosine 5'-[gamma-thio]triphosphate tetralithium salt) approximately = ATP >> UTP approximately = alphabeta meATP (alpha,beta-methylene-adenosine 5'-triphosphate)] and attenuation of the ATP response by MRS2179 (2'-deoxy-N6-methyladenosine-3',5'-bisphosphate) (P2Y1 antagonist) indicate that the excitation is mediated by P2Y1Rs. The post-ATP inhibition, which was never observed in response to ATPgammas, is dependent on ATP hydrolysis. These data establish in neonatal rats that respiratory rhythm generating networks in the preBötC are exquisitely sensitive to P2Y1R activation, and suggest a role for P2Y1Rs in respiratory motor control, particularly in the P2R excitation of rhythm that occurs during hypoxia.


Figures

Figure 1.
Figure 1.
Potentiation of frequency by ATP is dose dependent. A, ∫XII nerve recordings from a medullary slice preparation illustrating the response to local application of 0.01 and 0.1 mm ATP to site of maximum ATP sensitivity in the VLM. B, Group data showing the dose-dependent effects of ATP (0.01, 0.1, and 1 mm; n = 5, 6, and 4, respectively) on frequency. Rel. Freq., Relative frequency. *Significantly different from control; #significantly different from 0.01 mm ATP response. Error bars indicate SEM.
Figure 2.
Figure 2.
ATP potentiation of frequency is spatially restricted. A, Integrated XII nerve (∫XII) and surface preBötC field potential (∫preBötC) recordings from a medullary slice preparation illustrating the effects on inspiratory-related output of locally applying 0.1 mm ATP at the site of maximum sensitivity in the VLM (the hotspot) and at sites of varying distances from the hotspot. B, Group data illustrating the ATP responses, relative to the maximum response at the hotspot, evoked along different axes (indicated by different symbols) at various distances from hotspot. C, The time course of the response to ATP application at the hotspot and at sites 150 μm distant in the lateral, medial, dorsal, or ventral directions. *Significantly different from maximum response; #not significantly different from control. Error bars indicate SEM.
Figure 3.
Figure 3.
ATP-mediated potentiation of frequency is not affected by [K+]e. A, ∫XII nerve and ∫preBötC recordings illustrating the effect of locally applying 0.05 mm ATP to the preBötC in 3 and then 9 mm [K+]e. Group data (n = 5) are shown in B. Rel. Freq., Relative frequency. Error bars indicate SEM.
Figure 4.
Figure 4.
Anatomical identification of the ATP hotspot. A, Photomicrograph of a cresyl violet-stained, transverse medullary section (50 μm) showing the location of pontamine sky blue-labeled (arrow) hotspot. B, Higher magnification image of the boxed region in A. C, Schematic diagram of a transverse medullary section onto which the pontamine sky blue dye spots (ATP hot spots) were mapped (n = 10). Note that the most rostral and most caudal dye spots were separated by ∼100 μm along this axis. D, Transverse section of neonatal rat medulla illustrating the location of the pontamine sky blue dye spot (arrow), relative to scNA and NK1R immunolabeling. E, F, High magnification images of the boxed regions in D. Abbreviations: NTS, nucleus of the solitary tract; ROb, raphe obscurus; SpV, spinal trigeminal nucleus. Scale bar, 100 μm (in all panels).
Figure 5.
Figure 5.
The ATP hotspot is sensitive to NK1 and μ-opioid receptor activation. A, ∫XII nerve and ∫preBötC recordings illustrating the response to local application of ATP (0.1 mm), SP (1 μm), or DAMGO (50 μm) to the ATP hotspot. Group data (n = 6) illustrating the maximum frequency increase (B) and time course of responses (C) evoked by each agonist. *Significantly different from control. Error bars indicate SEM. Rel. Freq., Relative frequency.
Figure 6.
Figure 6.
P2X2 and NK1 receptor immunolabeling are present in the preBötC (PBC). A, Low-power (10×) image of a medullary slice illustrating immunolabeling for NK1R (red) and P2X2R (green) in the scNA and PBC. B–D, Higher-power (40×) images of NK1R (C; red) and P2X1 (D; green) immunolabeling in the preBötC region (boxed area in A) alone (C, D) and overlaid (B). The arrowheads in B indicate P2X2R-expressing preBötC neurons. The arrows indicate P2X2 and NK1R colocalization, seen as yellow, in some preBötC neurons.
Figure 7.
Figure 7.
ATP potentiation of frequency is not affected by the pH of the aCSF. A, ∫XII and ∫preBötC recordings illustrating the effects on inspiratory-related output in a single slice of locally applying ATP (0.05 mm) to the preBötC at pH 7.45 ± 0.01 (5% CO2) and pH 7.04 ± 0.02 (10% CO2/low HCO3). B, Histogram of group data illustrating the maximum frequency response evoked by locally applying ATP (0.1 and 0.05 mm) under conditions of high (5% CO2) and low (10% CO2/low HCO3) extracellular pH. Error bars indicate SEM. Rel. Freq., Relative frequency.
Figure 8.
Figure 8.
Effect of P2 receptor agonists and antagonists. A, Histogram of group data illustrating the response to local application within the hotspot of ATP (0.1 mm; n = 9), 2MeSATP (0.1 mm; n = 4), and αβmeATP (0.1 mm; n = 5). B, Histogram of group data illustrating the effects on frequency of locally applying ATP (0.1 mm), UTP (0.1 mm), and SP (1 μm) into the preBötC of the same medullary slice (n = 6). Group data illustrating that bath application of suramin (10–50 μm; n = 4) (C), PPADS (50 μm; n = 5) (D), or TNP-ATP (0.01–10 μm; n = 5) (F) had no significant effect on the frequency response evoked by locally applying ATP (0.1 mm) to the preBötC. Group data illustrating local application of PPADS (500 μm; 120 s total duration; n = 5) (E) starting 90 s before the ATP injection reversibly inhibited the ATP-evoked increase in frequency. *Significantly different from control. Error bars indicate SEM. Rel. Freq., Relative frequency.
Figure 9.
Figure 9.
P2Y1 receptor involvement in the ATP-induced frequency increase. ∫XII nerve recordings from a rhythmic medullary slice (A) and group data (B) (n = 12) comparing the responses evoked by applying ATP (0.1 mm) or the P2Y1 receptor agonist, 2MeSADP (0.1 mm) to the preBötC. C, E, ∫XII nerve recordings illustrating that preapplication of MRS2179 (100 μm; 2 min) to the preBötC reduced the response to ATP (C) and 2MeSADP (E). Group data showing attenuation of the ATP (D) or 2MeSADP (F) response in the presence of 50 and 100 μm MRS2179 (ATP, n = 9 and 8 for 50 and 100 μm, respectively; 2MeSADP, n = 8 and 6 for 50 and 100 μm, respectively.) *Significantly different from control. Error bars indicate SEM. Rel. Freq., Relative frequency.
Figure 10.
Figure 10.
P2Y1 and NK1 receptor immunolabeling are present in the preBötC (PBC). A, Low-power (10×) image of a medullary slice illustrating immunolabeling for NK1R (green) and P2Y1R (red) in the scNA and preBötC. B–D, Higher-power (40×) images of NK1R (C; green) and P2Y1R (D; red) immunolabeling in the preBötC region (boxed area in A) alone (C, D) and overlaid (B). The arrowheads in B indicate P2Y1R-expressing preBötC neurons. The arrows indicate P2Y1 and NK1R colocalization, seen as yellow, in some preBötC neurons.
Figure 11.
Figure 11.
The post-ATP inhibition of inspiratory frequency requires ATP hydrolysis. A, ∫XII nerve recordings illustrating the response to local application of ATP (0.1 mm) or ATPγs (0.1 mm) to the preBötC. Group data (n = 7) illustrating the maximum response (B) and time course (C) of the responses evoked by each agonist. *Significantly different from control. Error bars indicate SEM. Rel. Freq., Relative frequency.
Figure 12.
Figure 12.
Effect of a P2R antagonist and allosteric modulator on baseline inspiratory frequency. Group data illustrating the effects on frequency of bath-applied suramin (10–50 μm; n = 4) or CuCl2 (10–50 μm; n = 6) on baseline activity of rhythmically active medullary slices. Time-matched controls (tmc) (n = 6) show no change in frequency over the equivalent time period. *Significantly different from control. Error bars indicate SEM. Rel. Freq., Relative frequency.

Similar articles

Cited by

References

    1. Brosenitsch TA, Adachi T, Lipski J, Housley GD, Funk GD. Developmental downregulation of P2X3 receptors in motoneurons of the compact formation of the nucleus ambiguus. Eur J Neurosci. 2005;22:809–824. - PubMed
    1. Brown P, Dale N. Modulation of K+ currents in Xenopus spinal neurons by p2y receptors: a role for ATP and ADP in motor pattern generation. J Physiol (Lond) 2002;540:843–850. - PMC - PubMed
    1. Camaioni E, Boyer JL, Mohanram A, Harden TK, Jacobson KA. Deoxyadenosine bisphosphate derivatives as potent antagonists at P2Y1 receptors. J Med Chem. 1998;41:183–190. - PMC - PubMed
    1. Collo G, North RA, Kawashima E, Merlo-Pich E, Neidhart S, Surprenant A, Buell G. Cloning of P2X5 and P2X6 receptors and the distribution and properties of an extended family of ATP-gated ion channels. J Neurosci. 1996;16:2495–2507. - PMC - PubMed
    1. Dale N, Gilday D. Regulation of rhythmic movements by purinergic neurotransmitters in frog embryos. Nature. 1996;383:259–263. - PubMed

Publication types

MeSH terms

Substances

LinkOut - more resources