Comparative Study
. 2007 Jan 31;27(5):1015-23.
doi: 10.1523/JNEUROSCI.4593-06.2007.

Visual cortex allows prediction of perceptual states during ambiguous structure-from-motion

Affiliations
Comparative Study

Visual cortex allows prediction of perceptual states during ambiguous structure-from-motion

Gijs Joost Brouwer et al. J Neurosci. .

Abstract

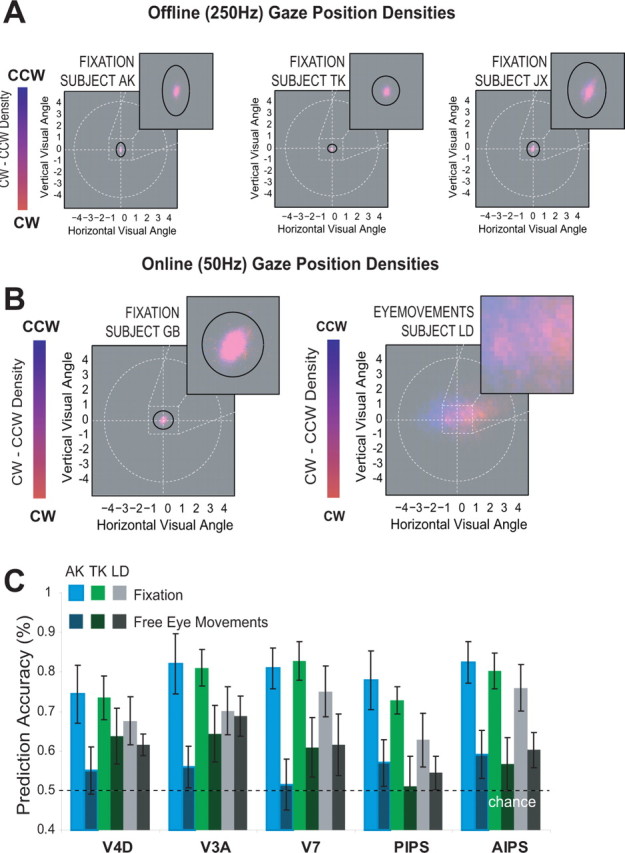
We investigated the role of retinotopic visual cortex and motion-sensitive areas in representing the content of visual awareness during ambiguous structure-from-motion (SFM), using functional magnetic resonance imaging (fMRI) and multivariate statistics (support vector machines). Our results indicate that prediction of perceptual states can be very accurate for data taken from dorsal visual areas V3A, V4D, V7, and MT+ and for parietal areas responsive to SFM, but to a lesser extent for other visual areas. Generalization of prediction was possible, because prediction accuracy was significantly better than chance for both an unambiguous stimulus and a different experimental design. Detailed analysis of eye movements revealed that strategic and even encouraged beneficial eye movements were not the cause of the prediction accuracy based on cortical activation. We conclude that during perceptual rivalry, neural correlates of visual awareness can be found in retinotopic visual cortex, MT+, and parietal cortex. We argue that the organization of specific motion-sensitive neurons creates detectable biases in the preferred direction selectivity of voxels, allowing prediction of perceptual states. During perceptual rivalry, retinotopic visual cortex, in particular higher-tier dorsal areas like V3A and V7, actively represents the content the visual awareness.


Figures

Figure 1.
Figure 1.
Multivariate analysis method. A, A priori, we identified ROIs by independent mapping procedures. B, The reported perceptual states, as indicated by the subject using button presses, were convolved with a canonical hemodynamic response function (HRF). This created two separate models for expected neural activation: one for activation as a function of perceiving CW rotation and one for activation as a function of perceiving CCW rotation. The resulting two time courses were subtracted and thresholded. As a result, whenever the predicted signal for CW perceived rotation is higher than the expected signal for CCW perceived rotation, that point in time was assigned to CW perceived rotation and vice versa. The main effect of this convolution approach is a temporal shift to account for the hemodynamic delay associated with the BOLD signal. C, We extracted voxel time courses from a particular ROI. These time courses were normalized (z-score normalization) and each volume of the voxel time course associated with a particular perceptual state, which were obtained from the time courses in B. D, Nine of 10 runs were then used to train our classifiers (SVM, perceptron, and differential mean) (see supplemental methods, available at www.jneurosci.org as supplemental material). For the SVM, this results in the creation of support vectors within the multidimensional feature space (features = voxels). For the perceptron model, this results in a weight vector such that if voxel intensities are multiplied with this vector, summed and thresholded, the model outputs a predicted perceptual state associated with these voxel intensities for a volume. Finally, for the differential mean approach, we obtained two weight vectors (one for each perceptual state) that were multiplied with voxel intensities and summed (dot-product between the voxel and weight vector). The predicted perceptual state is then equal to the perceptual state belonging to the weight vector with the highest associated dot-product between voxel intensities and the weight vector. E, The resulting classifiers were then used to predict the perceptual states for each volume in the remaining run. Both the SVM and differential mean produced a graded, continuous output and these were thresholded by determining, per volume, the sign of the output. The predictions were then compared with the actual perceived states over time and the accuracy of prediction calculated through dividing the number of correct predictions by the total number of predictions.
Figure 2.
Figure 2.
Stimulus and psychophysics. A, Arrows indicate the two perceived rotation direction of the front surface of the sphere: CW or CCW. B, The distribution of the perceptual phase durations (bars) during viewing of the ambiguously rotating sphere can be approximated by a gamma-distribution (solid line), as has been found for numerous other bistable stimuli. This indicates that our particular stimulus is a representative example of a bistable stimulus, even when its rotation has been slowed down to evoke relatively long-lasting perceptual phases (mean, 9.4 s; dotted line).
Figure 3.
Figure 3.
SVM accuracy. A, Raw SVM (black lines), thresholded predictions (blue lines), and actual perceived states (red lines) based on the activation of V7 in three subjects, demonstrating the striking accuracy of the prediction. Error bars represent SD of the mean. B, Average accuracy of SVMs per subject per ROI. Prediction was accurate for retinotopic areas V3A, V7, and V4D, as well as area MT+ and the parietal areas sensitive to structure-from-motion. For the other visual areas, accuracy is lower but in most cases still significantly greater than chance. For the FEFs, FFA, and PPA, prediction was at chance level. The asterisks indicate the areas for which in all individual subjects, accuracy was significantly greater than chance (p < 0.001).
Figure 4.
Figure 4.
Intersubject differences in accuracy. A, Dependency of the accuracy (based on the voxels of V1 and V7) on the mean perceptual durations per subject (color coding) for all 10 runs. As perceptual durations decreased in length, so did the accuracy. This explains the relatively poor performance for JX, as well as the high performance for AK. B, Comparison of sustained and transient models. For the data of V7, the sustained model (assuming signal changes correlate with the perceptual durations) outperforms the transient model (assuming signal change correlate with the transitions between perceptual states) in terms of the accuracy of the classifier that has been trained. For the data of V1, sustained and transient models do not differ in the accuracy. Error bars represent SD of the mean.
Figure 5.
Figure 5.
Generalization. Accuracy of the prediction when the SVM was trained on the data from the disambiguated sphere experiment (black discs) and on the data from an entirely different experiment (gray discs) of Brouwer et al. (2007). Accuracy is reduced, but significantly greater than chance for areas V3A, V7, and MT+ and the two parietal areas SFM-aIPS and SFM-pIPS. This indicates that generalization, a key feature in prediction, is possible between sessions and stimuli. Error bars represent SD of the mean.
Figure 6.
Figure 6.
Eye movements. A, Gaze position density plots for three subjects during the off-line eye tracking experiments with strict fixation instructions. In these density plots, the color gradient coding indicates how frequent a particular location was visited during the two perceptual states; the white circle reflects the stimulus circumference. The inset shows the region around fixation. Dark ellipses indicate the region containing 95% off all gaze positions. In all subjects, gaze positions fall within an area ∼1° of visual angle around the fixation spot. Furthermore, differences in mean gaze positions between perceptual states were minute. B, Gaze position densities for two subjects during the imaging experiments with strict fixation (subject GB, left) and with beneficial eye movements allowed and encouraged (subject LD, right). Subject LD used strategic eye movements, as her gaze positions depended on the perceptual state. C, A comparison of prediction accuracy based on the activation taken from visual areas that showed the highest accuracy in the main experiment, during strict fixation (light bars) and during eye movement conditions (dark bars) for the three subjects who participated in both imaging studies. Prediction accuracy is reduced when eye movements are allowed, demonstrating that even beneficial and strategic eye movements are not responsible for the observed accuracy in the main (fixation) imaging experiment.

Similar articles

Cited by

References

    1. Andersen RA, Bradley DC. Perception of three-dimensional structure from motion. Trends Cogn Neurosci. 1998;2:222–228. - PubMed
    1. Blake R, Logothetis NK. Visual competition. Nat Rev Neurosci. 2002;3:13–21. - PubMed
    1. Bradley DC, Qian N, Andersen RA. Encoding of three-dimensional structure-from-motion by primate area MT neurons. Nature. 1998;392:609–611. - PubMed
    1. Brascamp JW, van Ee R, Pestman WR, van den Berg AV. Distributions of alternation rates in various forms of bistable perception. J Vision. 2005;5:287–298. - PubMed
    1. Brouwer GJ, van Ee R. Endogenous influences on perceptual bistability depend on exogenous stimulus characteristics. Vis Res. 2006;46:3393–3402. - PubMed

Publication types

MeSH terms

LinkOut - more resources