Comparative Study
. 2007 Jan 31;27(5):1072-81.
doi: 10.1523/JNEUROSCI.4746-06.2007.

Drosophila cacophony channels: a major mediator of neuronal Ca2+ currents and a trigger for K+ channel homeostatic regulation

Affiliations
Comparative Study

Drosophila cacophony channels: a major mediator of neuronal Ca2+ currents and a trigger for K+ channel homeostatic regulation

I-Feng Peng et al. J Neurosci. .

Abstract

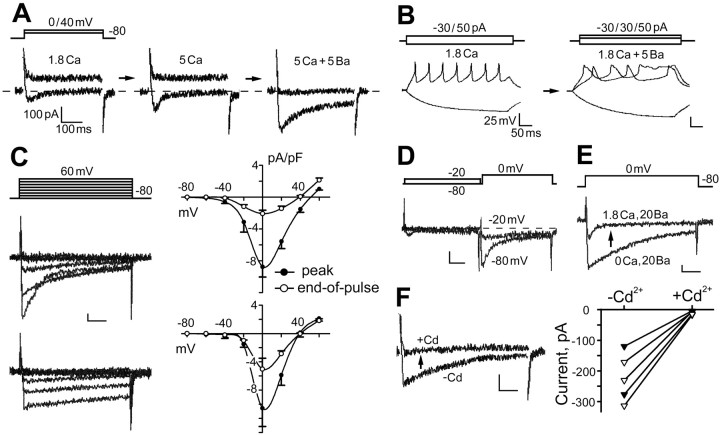
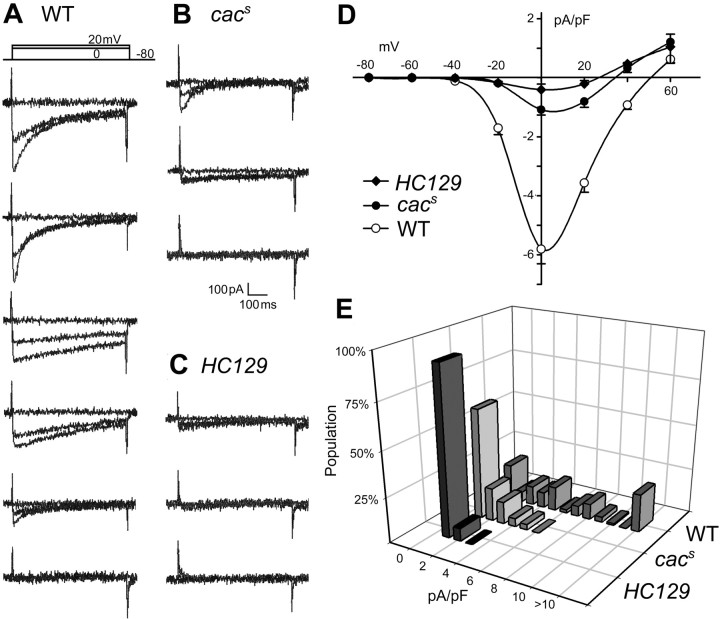
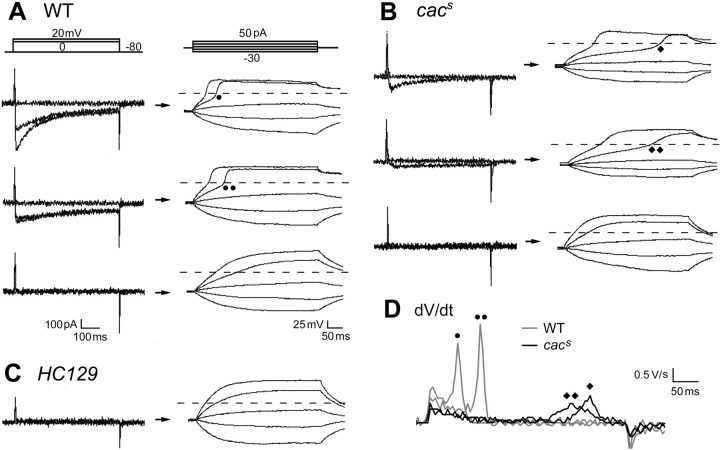
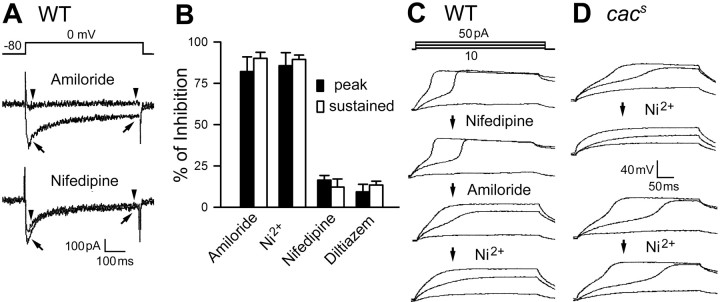
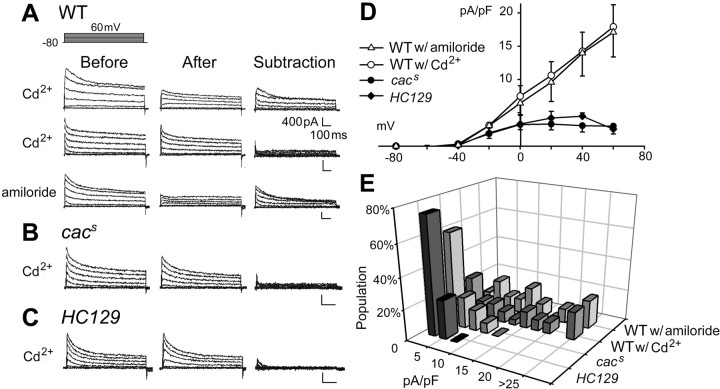
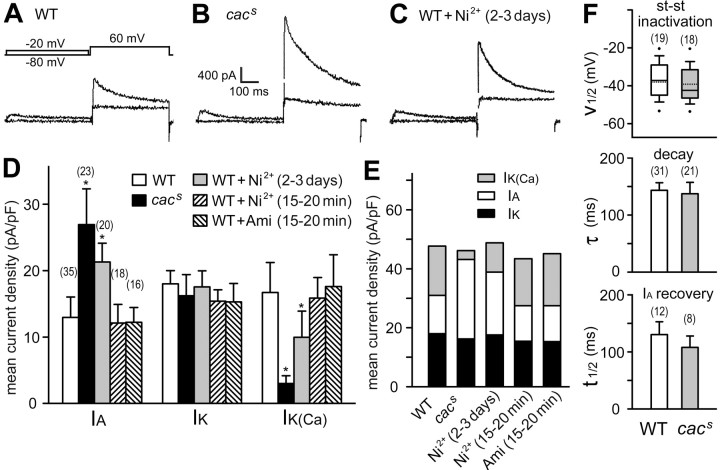
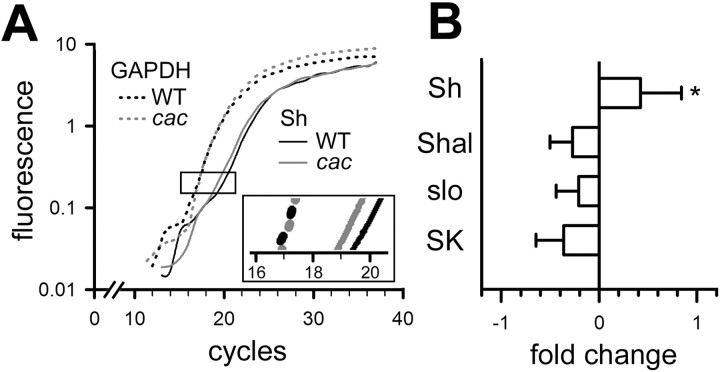
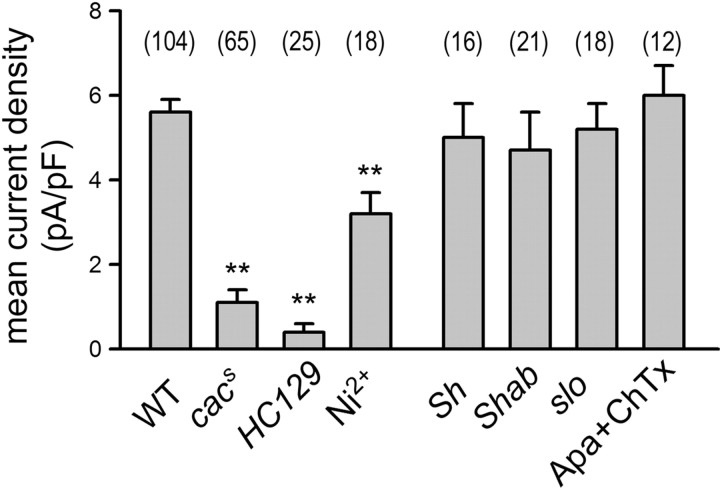
The cacophony (cac) locus in Drosophila encodes a Ca2+ channel alpha subunit, but little is known about properties of cac-mediated currents and functional consequences of cac mutations in central neurons. We found that, in Drosophila cultured neurons, Ca2+ currents were mediated predominantly by the cac channels. The cac channels contribute to low- and high-threshold, fast- and slow-inactivating types of Ca2+ currents, take part in membrane depolarization, and strongly activate Ca2+-activated K+ current [I(K(Ca))]. In cac neurons, unexpectedly, voltage-activated transient K+ current I(A) is upregulated to a level that matches I(K(Ca)) reduction, implicating a homeostatic regulation that was mimicked by chronic pharmacological blockade of Ca2+ currents in wild-type neurons. Among K+ channel transcripts, Shaker mRNA levels were preferentially increased in cac flies. However, Ca2+ current expression levels remained unaltered in several K+ channel mutants, illustrating a key role of cac in developmental regulation of Drosophila neuronal excitability.


Figures

Figure 1.
Figure 1.
Properties of Ca2+ channels in cultured Drosophila giant neurons. A, Whole-cell voltage clamping of Ca2+ currents in standard bath solution containing TTX to block Na+ current, with K+ currents suppressed by using K+-free, Cs+ pipette solution. Superimposed current traces elicited by voltage-clamp steps from −80 to 0 and +40 mV are shown. The amplitude of inward currents (I Ca) at 0 mV increased with the elevation of extracellular Ca2+ (from 1.8 to 5 mm). An additional 5 mm Ba2+ further enhanced the inward current [I Ba(Ca)]. Note the suppression of outward currents at +40 mV by Ba2+ application. B, Spike trains initiated during current clamping in standard bath solution. Note broadening of the action potentials after 5 mm Ba2+ application. C, Kinetics and voltage dependence of I Ba(Ca). To isolate inward currents, standard bath solution contained 20 mm Ba2+, 1.8 mm Ca2+, TTX, 4-AP, TEA, and quinidine (see Materials and Methods). As shown in the two sets of superimposed current traces, two distinct kinetic components of I Ba(Ca) were evident, which displayed fast versus slow inactivation (τ of <100 vs >300 ms at 0 mV). The ensemble I–V curves present data from neurons with a dominant fast-inactivating component (n = 49; top) and from neurons with only slow-inactivating components (n = 35; bottom). Note that the fast-inactivating component had a lower threshold. D, Physiological separation of fast- and slow-inactivating components. The superimposed traces show consecutive current records for the effect of a 0.5 s, −20 mV prepulse in removing the fast-inactivating component. E, Ca2+-dependent inactivation of I Ba(Ca). Superimposed current traces from consecutive records of the same cell demonstrate that fast inactivation of I Ba(Ca) did not occur in Ca2+-free solution. F, Removal of I Ba(Ca) by 0.2 mm Cd2+ in neurons with different decay kinetics. Neurons displaying fast- or slow-inactivating component were represented by filled or open symbols, respectively. Vertical calibration bars: 100 pA or 25 mV. Horizontal calibration bars: 100 ms for voltage-clamp traces and 50 ms for current-clamp traces. Standard bath solution was composed of the following (in mm): 128 NaCl, 2 KCl, 4 MgCl2, 1.8 CaCl2, and 35.5 sucrose, buffered at pH 7.1 with 5 HEPES.
Figure 2.
Figure 2.
Neuronal Ca2+ channels encoded by cac. A, Representative traces from six WT neurons with different I Ba(Ca) density and kinetics. Neurons with no detectable I Ba(Ca) were rare (bottom). B, Strong reduction of I Ba(Ca) in cac s mutant neurons. The remaining I Ba(Ca) still displayed fast- or slow-inactivation kinetics. Neurons without detectable I Ba(Ca) were frequently encountered. C, Near elimination of I Ba(Ca) in neurons of l(1)L13 HC129 deficiency line. Most neurons from this line produced no detectable I Ba(Ca). D, I–V relationships for peak I Ba(Ca) from different genotypes [n = 104, 65, and 25 for WT, cac s, and l(1)L13 HC129]. E, Histograms of I Ba(Ca) density at 0 mV. Note abundance of neurons without detectable I Ba(Ca) in both cac s and l(1)L13 HC129 cultures.
Figure 3.
Figure 3.
Weakened regenerative potentials in cac neurons. A, Relationships of inward currents and regenerative potentials in WT neurons. In addition to 20 mm Ba2+, TTX and K+ channel blockers (Fig. 1 legend) were present in standard bath solution. Therefore, the inward currents and regenerative potentials sequentially recorded from the same cells reflected Ca2+ channel activity. Note the inflection points at which the regenerative potential was initiated. Depolarization of neurons with I Ba(Ca) reached a plateau level, which is determined by the equilibrium potential of the inward current and is independent of additional increase of current injection. In neurons lacking detectable I Ba(Ca) (bottom), membrane polarization was proportional to the amount of current injected, following the kinetics determined by passive membrane properties. Dash lines indicate 0 mV. B, C, Weakened regenerative potentials associated with decreased I Ba(Ca) in cac mutant neurons. D, Reduced rate of depolarization (dV/dt) during initiation of regenerative potentials in cac mutant neurons. The corresponding rate of membrane potential change of the selected traces in A and B are indicated by circles and diamonds next to the inflection point, around which maximum dV/dt occurs.
Figure 4.
Figure 4.
Sensitivity of Drosophila neuronal Ca2+ channels to T-type channel blockers. Two T-type channel blockers, amiloride (1 mm) and Ni2+ (0.1 mm), and two L-type channel blockers, nifedipine (10 μm) and diltiazem (0.5 mm), were examined. A, Superimposed current traces obtained before (arrows) and after (arrowheads) amiloride and nifedipine treatments in WT neurons. B, Percentage of I Ba(Ca) inhibition by different drugs in WT neurons. Reduction in both peak and sustained components (measured at the times indicated by arrows and arrowheads in A) indicates that both fast- and slow-inactivating components of Ca2+ currents were sensitive to amiloride and Ni2+ (n = 6 and 7, respectively). In contrast, nifedipine and diltiazem removed <20% of the I Ba(Ca) (n = 6 and 5, respectively). C, D, Different drug effects on regenerative membrane potentials in WT and cac neurons. Nifedipine exerted little effect, but amiloride and Ni2+ progressively removed regenerative potentials in WT neurons (an example of sequential recording shown in C). In contrast, only some cac s neurons examined were sensitive to Ni2+ (4 of 7; top in D) and amiloride (2 of 4), but the remaining samples were unaffected by either Ni2+ (bottom) or amiloride.
Figure 5.
Figure 5.
Severe reduction of Ca2+-activated K+ currents [I K(Ca)] in cac neurons. I K(Ca) was extracted from subtracting Cd2+-sensitive currents from total outward current in standard bath saline, in which Cd2+ (0.2 mm) was added to eliminate Ca2+-dependent currents. The difference in current amplitude before and after Cd2+ treatment yields I K(Ca) with a minimal contamination of I Ca (<5%; compare with Fig. 1 A). A, I K(Ca) in WT cultures. Most WT neurons (>60%) produced large I K(Ca) (>6 pA/pF) with a minority displaying little I K(Ca). Application of amiloride to block cac channels produced similar estimates of I K(Ca). B, C, Strong suppression of I K(Ca) in cac s and l(1)L13 HC129 mutant cultures. D, Ensemble I–V curves demonstrating strong suppression of I K(Ca) in cac mutant cultures. Note that estimation of I K(Ca) based on extraction of amiloride-sensitive K+ currents in WT neurons produced results similar to Cd2+-sensitive K+ currents. E, Histograms of I K(Ca) amplitude distribution. Note the similarities between I K(Ca) and I Ba(Ca) density distributions for WT as well as cac mutant alleles (compare with Fig. 2 E). Sample sizes, n = 28, 8, 19, and 10 for WT with Cd2+, WT with amiloride, cac s, and l(1)L13 HC129.
Figure 6.
Figure 6.
Homeostatic upregulation of voltage-dependent I A in cac neurons. A–C, Separation of transient I A and sustained I K by a prepulse protocol after removal of Ca2+-dependent currents by Cd2+. Representative traces demonstrate a substantial I A increase in cac s neurons compared with WT neurons. WT neurons pretreated with the cac channel blocker Ni2+ (0.05 mm) for 3 d phenocopied upregulation of I A observed in cac neurons. D, Mean current densities for extracted I A, I K, and I K(Ca). Note upregulation in I A but not I K in cac s neurons and WT neurons with chronic blockade (2–3 d) of cac channels. However, short-term blockade (15–20 min) of cac channels by Ni2+ or amiloride (0.5 mm) did not alter current densities. *p < 0.05 against WT, one-way ANOVA. E, Summation of I A, I K, and I K(Ca) among neurons of different genotypes or with drug treatments. Note the similar total K+ currents, which suggest a homeostatic, compensatory increase of I A for reduction of I K(Ca). F, Properties of upregulated I A in cac neurons compared with WT I A. Steady-state (st-st) inactivation of I A is compared for V 1/2, at which half-inactivation is attained. Solid and dashed lines in the box plots indicate median and mean values. Decay time constant (τ) was determined at +60 mV. Half-time (t 1/2) of I A recovery from inactivation was determined with a twin-pulse (+20 mV) protocol with varying interpulse intervals. Data indicate no significant differences in these biophysical parameters. Error bars represent SEM with sample sizes indicated.
Figure 7.
Figure 7.
Determination of mRNA abundance for K+ channels in WT and cac neurons by RT-PCR. A, Amplification rates of GAPDH and Sh transcripts from WT and cac fly heads based on the accumulation of fluorescence intensity throughout PCR cycles. Inset, Enlargement for the segment between cycles 16 and 20. The rate for the Sh fragment in cac mutants was faster than that in WT, but the rate for the control GAPDH fragment was nearly identical for the two genotypes. B, Differences in transcript abundance of Sh and Shal I A channels and of slo and SK I K(Ca) channels between WT and cac. The mRNA levels for individual K+ channel genes are estimated by the fluorescence change normalized to GAPDH control. The positive value in the bar graph indicates an increase in RNA abundance in cac over WT. Data from three independent RNA purifications. Error bars indicate SD. *p < 0.05, two-way ANOVA for genotype and channel subtype comparisons.
Figure 8.
Figure 8.
Lack of modifications in Ca2+ channel-mediated currents in K+ channel mutants. Mean I Ba(Ca) densities among neurons in cac and Ni2+-treated WT cultures are compared with cultures of K+ channel mutants. Sh M, with altered I A, Shab 3, with defective to I K, slo 1, with defective to I K(Ca). No modifications of I Ba(Ca) densities were found in K+ channel mutant neurons and in WT neurons with chronic blockade (2–3 d) of Ca2+-activated K+ channels by 5 μm apamine and 50 nm charybdotoxin (Apa + ChTx). Error bars represent SEM with sample sizes indicated. **p < 0.005 against WT control, one-way ANOVA.

Similar articles

Cited by

References

    1. Adelman JP, Shen KZ, Kavanaugh MP, Warren RA, Wu YN, Lagrutta A, Bond CT, North RA. Calcium-activated potassium channels expressed from cloned complementary DNAs. Neuron. 1992;9:209–216. - PubMed
    1. Alkon DL. Ionic conductance determinants of synaptic memory nets and their implications for Alzheimer's disease. J Neurosci Res. 1999;58:24–32. - PubMed
    1. Alkon DL, Shoukimas JJ, Heldman E. Calcium-mediated decrease of a voltage-dependent potassium current. Biophys J. 1982;40:245–250. - PMC - PubMed
    1. Atkinson NS, Robertson GA, Ganetzky B. A component of calcium-activated potassium channels encoded by the Drosophila slo locus. Science. 1991;253:551–555. - PubMed
    1. Baker K, Salkoff L. The Drosophila Shaker gene codes for a distinctive K+ current in a subset of neurons. Neuron. 1990;4:129–140. - PubMed

Publication types

LinkOut - more resources