

The critical role of locomotion mechanics in decoding sensory systems
- PMID: 17267567
- PMCID: PMC6673190
- DOI: 10.1523/JNEUROSCI.4198-06.2007
The critical role of locomotion mechanics in decoding sensory systems
Abstract
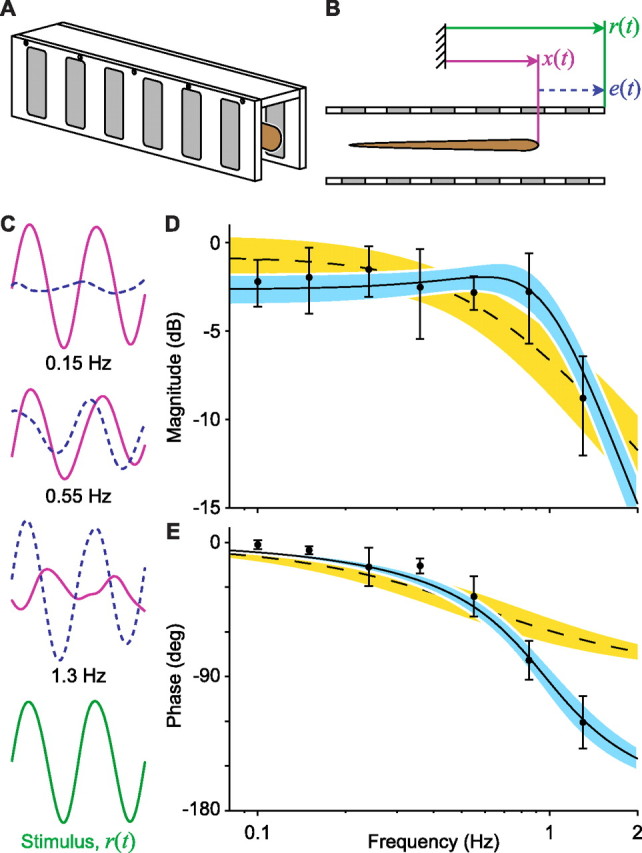
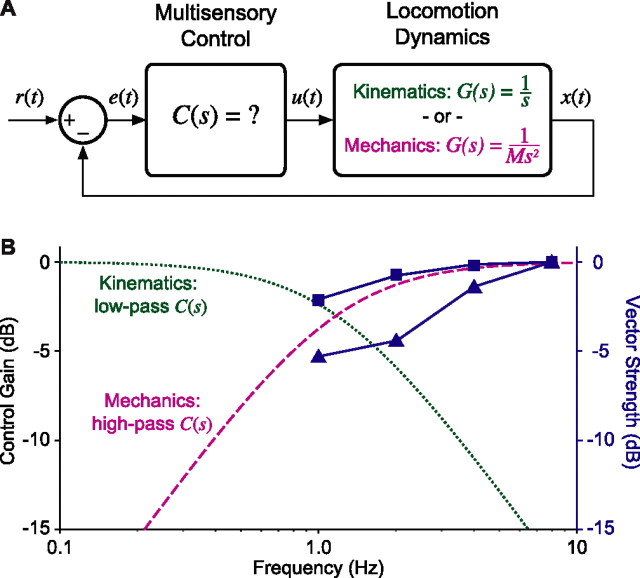
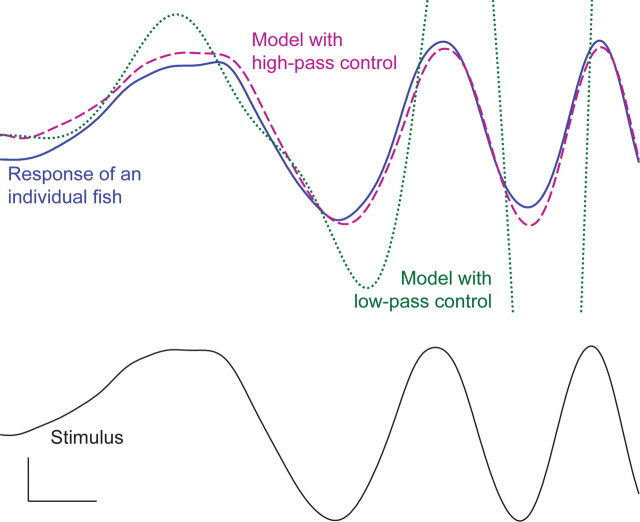
How do neural systems process sensory information to control locomotion? The weakly electric knifefish Eigenmannia, an ideal model for studying sensorimotor control, swims to stabilize the sensory image of a sinusoidally moving refuge. Tracking performance is best at stimulus frequencies less than approximately 1 Hz. Kinematic analysis, which is widely used in the study of neural control of movement, predicts commensurately low-pass sensory processing for control. The inclusion of Newtonian mechanics in the analysis of the behavior, however, categorically shifts the prediction: this analysis predicts that sensory processing is high pass. The counterintuitive prediction that a low-pass behavior is controlled by a high-pass neural filter nevertheless matches previously reported but poorly understood high-pass filtering seen in electrosensory afferents and downstream neurons. Furthermore, a model incorporating the high-pass controller matches animal behavior, whereas the model with the low-pass controller does not and is unstable. Because locomotor mechanics are similar in a wide array of animals, these data suggest that such high-pass sensory filters may be a general mechanism used for task-level locomotion control. Furthermore, these data highlight the critical role of mechanical analyses in addition to widely used kinematic analyses in the study of neural control systems.
Figures
Similar articles
-
Variability in locomotor dynamics reveals the critical role of feedback in task control.Elife. 2020 Jan 23;9:e51219. doi: 10.7554/eLife.51219. Elife. 2020. PMID: 31971509 Free PMC article.
-
Dynamic modulation of visual and electrosensory gains for locomotor control.J R Soc Interface. 2016 May;13(118):20160057. doi: 10.1098/rsif.2016.0057. J R Soc Interface. 2016. PMID: 27170650 Free PMC article.
-
Temporal filtering properties of ampullary electrosensory neurons in the torus semicircularis of Eigenmannia: evolutionary and computational implications.Brain Behav Evol. 1997;49(6):312-23. doi: 10.1159/000113000. Brain Behav Evol. 1997. PMID: 9167857
-
Encoding and processing biologically relevant temporal information in electrosensory systems.J Comp Physiol A Neuroethol Sens Neural Behav Physiol. 2006 Jun;192(6):625-35. doi: 10.1007/s00359-006-0102-0. Epub 2006 Feb 1. J Comp Physiol A Neuroethol Sens Neural Behav Physiol. 2006. PMID: 16450118 Review.
-
Roles for short-term synaptic plasticity in behavior.J Physiol Paris. 2002 Sep-Dec;96(5-6):539-45. doi: 10.1016/S0928-4257(03)00009-3. J Physiol Paris. 2002. PMID: 14692501 Review.
Cited by
-
Complementary feedback control enables effective gaze stabilization in animals.Proc Natl Acad Sci U S A. 2022 May 10;119(19):e2121660119. doi: 10.1073/pnas.2121660119. Epub 2022 May 3. Proc Natl Acad Sci U S A. 2022. PMID: 35503912 Free PMC article.
-
Motor patterns during active electrosensory acquisition.Front Behav Neurosci. 2014 May 28;8:186. doi: 10.3389/fnbeh.2014.00186. eCollection 2014. Front Behav Neurosci. 2014. PMID: 24904337 Free PMC article.
-
Delay-Dependent Response in Weakly Electric Fish under Closed-Loop Pulse Stimulation.PLoS One. 2015 Oct 16;10(10):e0141007. doi: 10.1371/journal.pone.0141007. eCollection 2015. PLoS One. 2015. PMID: 26473597 Free PMC article.
-
Parallel sparse and dense information coding streams in the electrosensory midbrain.Neurosci Lett. 2015 Oct 21;607:1-6. doi: 10.1016/j.neulet.2015.09.014. Epub 2015 Sep 12. Neurosci Lett. 2015. PMID: 26375927 Free PMC article.
-
Entrainment Ranges for Chains of Forced Neural and Phase Oscillators.J Math Neurosci. 2016 Dec;6(1):6. doi: 10.1186/s13408-016-0038-9. Epub 2016 Apr 18. J Math Neurosci. 2016. PMID: 27091694 Free PMC article.
References
-
- Barron A, Srinivasan M. Visual regulation of ground speed and headwind compensation in freely flying honey bees (Apis mellifera L.) J Exp Biol. 2006;209:978–984. - PubMed
-
- Bastian J. Vision and electroreception: integration of sensory information in the optic tectum of the weakly electric fish Apteronotus albifrons. J Comp Physiol A Neuroethol Sens Neural Behav Physiol. 1982;147:287–297.
-
- Bastian J. Electrolocation: behavior, anatomy, and physiology. In: Bullock TH, Heiligenberg W, editors. Electroreception. New York: Wiley; 1986. pp. 577–612.
-
- Blake RW. Swimming in the electric eels and knifefishes. Can J Zool. 1983;61:1432–1441.
-
- Blickhan R, Full RJ. Similarity in multilegged locomotion: bouncing like a monopode. J Comp Physiol A Neuroethol Sens Neural Behav Physiol. 1993;173:509–517.
Publication types
MeSH terms
LinkOut - more resources
Full Text Sources
Other Literature Sources