Comparative Study
. 2007 Jan 31;27(5):1151-60.
doi: 10.1523/JNEUROSCI.5010-06.2007.

Transducin translocation in rods is triggered by saturation of the GTPase-activating complex

Affiliations
Comparative Study

Transducin translocation in rods is triggered by saturation of the GTPase-activating complex

Ekaterina S Lobanova et al. J Neurosci. .

Abstract

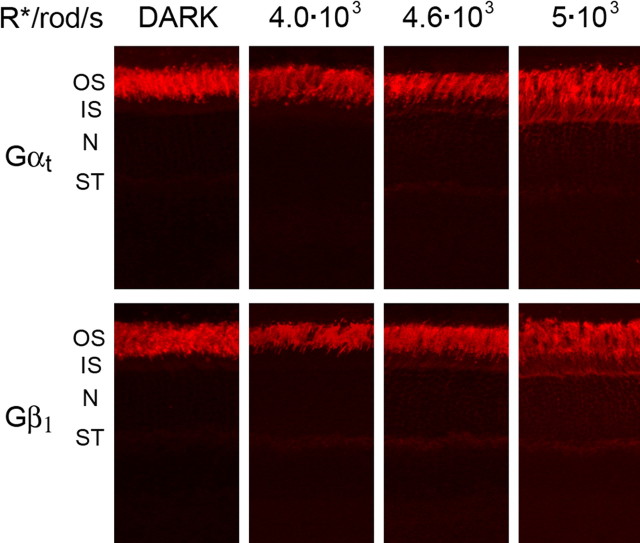
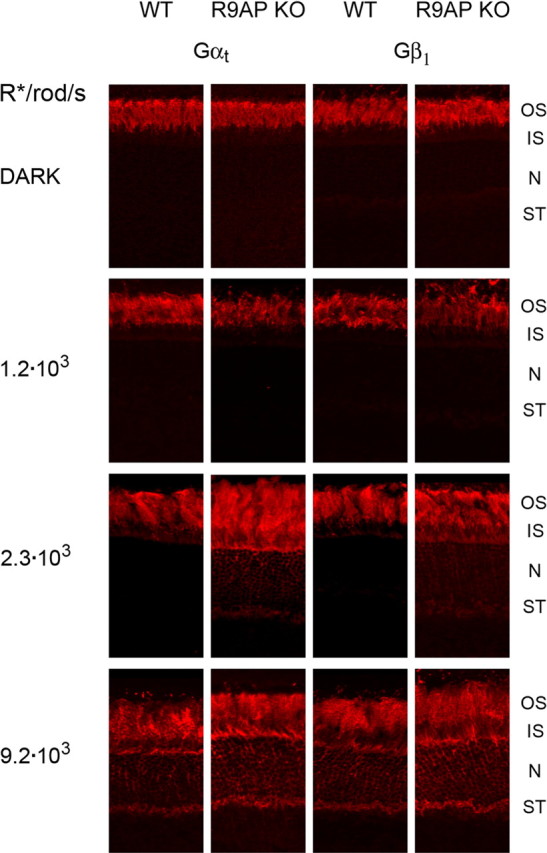
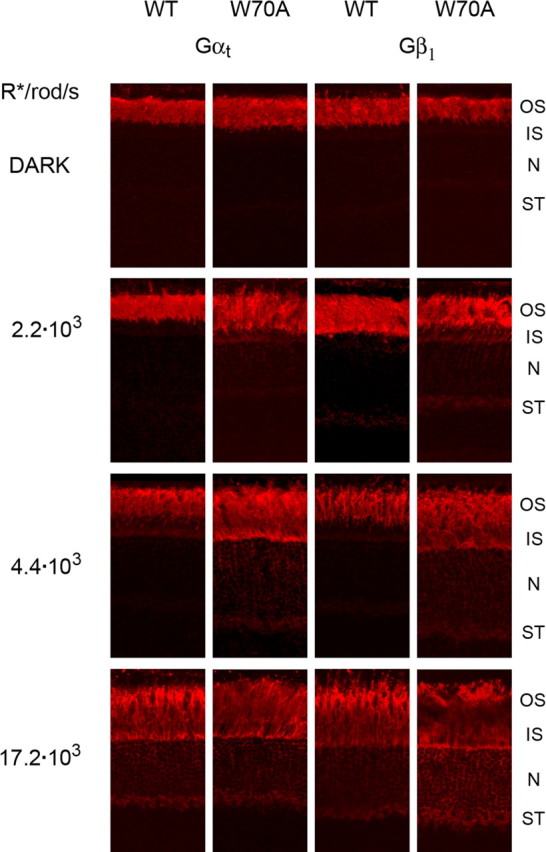
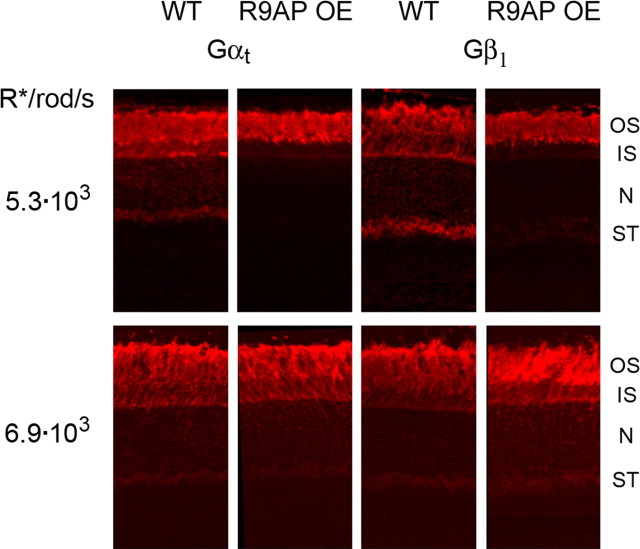
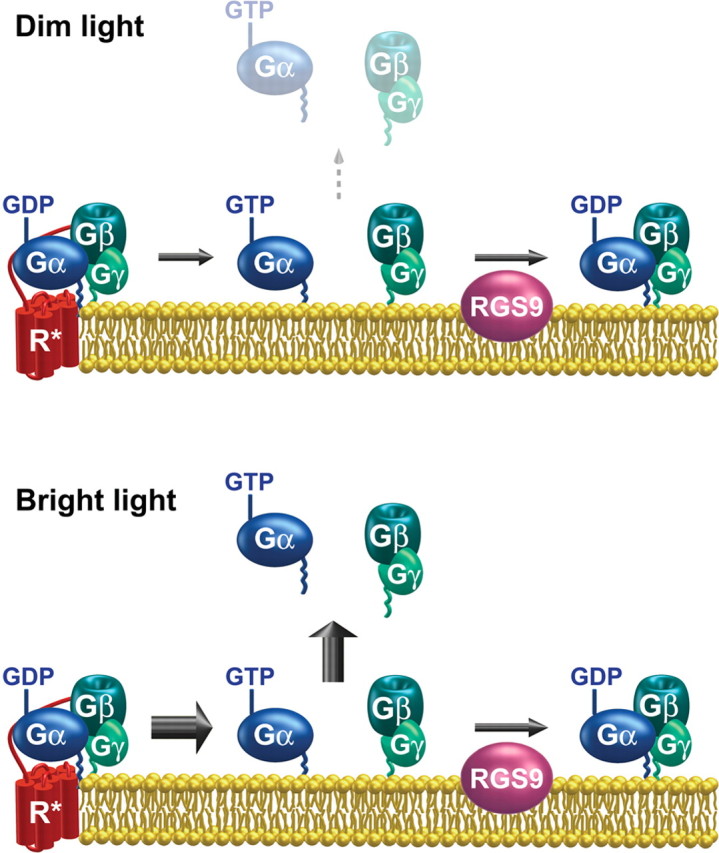
Light causes massive translocation of G-protein transducin from the light-sensitive outer segment compartment of the rod photoreceptor cell. Remarkably, significant translocation is observed only when the light intensity exceeds a critical threshold level. We addressed the nature of this threshold using a series of mutant mice and found that the threshold can be shifted to either a lower or higher light intensity, dependent on whether the ability of the GTPase-activating complex to inactivate GTP-bound transducin is decreased or increased. We also demonstrated that the threshold is not dependent on cellular signaling downstream from transducin. Finally, we showed that the extent of transducin alpha subunit translocation is affected by the hydrophobicity of its acyl modification. This implies that interactions with membranes impose a limitation on transducin translocation. Our data suggest that transducin translocation is triggered when the cell exhausts its capacity to activate transducin GTPase, and a portion of transducin remains active for a sufficient time to dissociate from membranes and to escape from the outer segment. Overall, the threshold marks the switch of the rod from the highly light-sensitive mode of operation required under limited lighting conditions to the less-sensitive energy-saving mode beneficial in bright light, when vision is dominated by cones.


Figures

Figure 1.
Figure 1.
The light-dependent distribution of transducin subunits in wild-type mice. C57BL/6 mice were either dark adapted or exposed to 30 min of illumination from a calibrated light source producing photoexcited rhodopsin at initial rates indicated above each panel. The subcellular compartments of the rod are labeled as follows: OS, outer segment; IS, inner segment; N, nucleus; ST, synaptic terminal. Note that significant changes in the inner segment and nuclear layer immunostaining become evident at the photoexcitation level of 4600 R* · rod−1 · s−1 and prominent at 5000 R* · rod−1 · s−1. The data are representative of the total of 11 mice analyzed at these and close light intensities.
Figure 2.
Figure 2.
Comparison of transducin subunit distribution in wild-type (WT) and R9AP knock-out (R9AP KO) mice. Animals were either dark adapted or exposed to 30 min of illumination producing photoexcited rhodopsin at initial rates indicated on the left of each panel. Mice subjected to light of each intensity were analyzed on the same day; their immunostaining was performed on the same slide and visualized using the same microscope settings. Note a major difference in immunostaining patterns at the light intensity producing 2300 R* · rod−1 · s−1. OS, Outer segment; IS, inner segment; N, nucleus; ST, synaptic terminal.
Figure 3.
Figure 3.
Comparison of transducin subunit distribution in wild-type (WT) and W70A mice. Animals were either dark adapted or exposed to 30 min of illumination producing photoexcited rhodopsin at initial rates indicated on the left of each panel. Note that the difference in immunostaining patterns becomes evident at the light intensity producing 2200 R* · rod−1 · s−1 and prominent at 4400 R* · rod−1 · s−1, when the translocation in the wild type just begins. OS, Outer segment; IS, inner segment; N, nucleus; ST, synaptic terminal.
Figure 4.
Figure 4.
Comparison of transducin subunit distribution in wild-type (WT) and R9AP-overexpressing (R9AP OE) mice. Animals were either dark adapted or exposed to 30 min of illumination producing photoexcited rhodopsin at initial rates indicated on the left of each panel. Note the difference in immunostaining at the light intensity producing 5300 R* · rod−1 · s−1, which is above the translocation threshold in wild-type mice. OS, Outer segment; IS, inner segment; N, nucleus; ST, synaptic terminal.
Figure 5.
Figure 5.
The dependency of Gαt translocation on the type of its N-terminal acylation in dark-adapted (left) and light-adapted (right) rats. Anesthetized animals were kept in the dark or exposed to 40 min of illumination (240 scotopic cd/m2 at the cornea surface), and their retinas were extracted and prepared for serial tangential sectioning (see Materials and Methods). Sections representing the same subcellular compartments were pooled from four dark-adapted and five light-adapted retinas. A, The distribution of Gαt and two intracellular markers, rhodopsin (Rho) and cytochrome C (Cyt C), was analyzed in small aliquots by Western blotting. B, A schematic drawing of a rod cell. OS, Outer segment; IS, inner segment; N, nucleus; ST, synaptic terminal. C, Gαt was immunoprecipitated from each pool of the sections and separated from coeluting IgG heavy (IgG/HC) and light (IgG/LC) chains by SDS-PAGE. D, The fraction of each acylated isoform of Gαt is expressed as a percentage of the total of all isoforms. The amount of each isoform was determined on the basis of the isotope cluster areas of individually acylated N-terminal peptides quantified by MALDI-TOF mass spectrometry. The data are taken from two independent mass spectrometry determinations, with error bars representing the scatter of the data.
Figure 6.
Figure 6.
The capacity of the RGS9 GTPase-activating complex determines the light intensity threshold of transducin translocation. The amount of activated transducin in each case is encoded by the thickness of arrows. Top, At the light intensity below threshold, activated transducin is quickly inactivated by RGS9, providing little time for dissociating from the membrane. Bottom, At the light intensity above threshold, more transducin is activated than could be readily inactivated by RGS9, and a fraction of transducin stays activated sufficiently long to dissociate from the membrane to the cytosol. The diagram is simplified by not illustrating the reversibility of transducin membrane association, Gαt interaction with cGMP phosphodiesterase, and Gβ1γ1 interaction with phosducin, each likely to affect specific parameters of the membrane/cytosol distribution of transducin. The basic elements of this diagram are reproduced with permission from Calvert et al. (2006).

Comment in

Similar articles

Cited by

References

    1. Angleson JK, Wensel TG. Enhancement of rod outer segment GTPase accelerating protein activity by the inhibitory subunit of cGMP phosphodiesterase. J Biol Chem. 1994;269:16290–16296. - PubMed
    1. Arshavsky VY, Dumke CL, Zhu Y, Artemyev NO, Skiba NP, Hamm HE, Bownds MD. Regulation of transducin GTPase activity in bovine rod outer segments. J Biol Chem. 1994;269:19882–19887. - PubMed
    1. Brann MR, Cohen LV. Diurnal expression of transducin mRNA and translocation of transducin in rods of rat retina. Science. 1987;235:585–587. - PubMed
    1. Burns ME, Arshavsky VY. Beyond counting photons: trials and trends in vertebrate visual transduction. Neuron. 2005;48:387–401. - PubMed
    1. Calvert PD, Strissel KJ, Schiesser WE, Pugh EN, Jr, Arshavsky VY. Light-driven translocation of signaling proteins in vertebrate photoreceptors. Trends Cell Biol. 2006;16:560–568. - PubMed

Publication types

MeSH terms

LinkOut - more resources