Comparative Study
. 2007 Jan 31;27(5):1200-10.
doi: 10.1523/JNEUROSCI.4908-06.2007.

Munc13-1 C1 domain activation lowers the energy barrier for synaptic vesicle fusion

Affiliations
Comparative Study

Munc13-1 C1 domain activation lowers the energy barrier for synaptic vesicle fusion

Jayeeta Basu et al. J Neurosci. .

Abstract

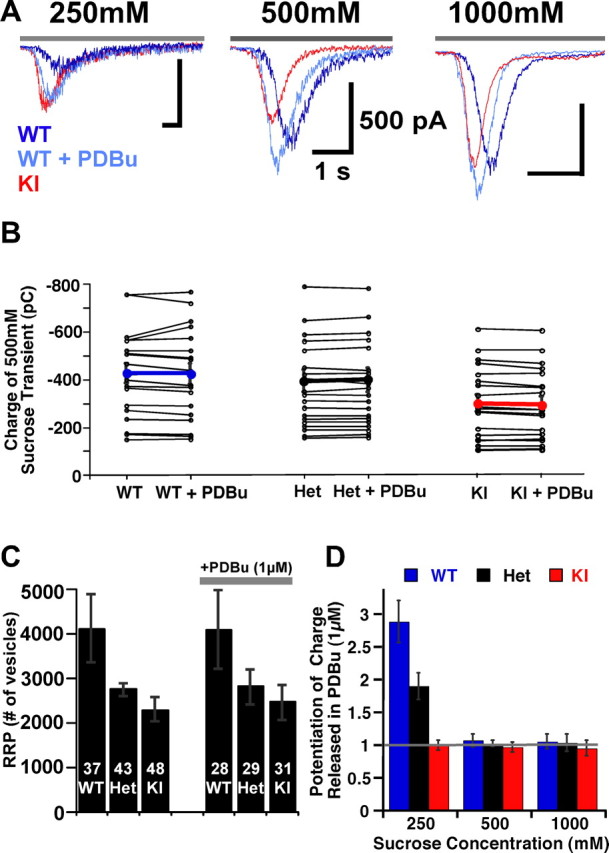
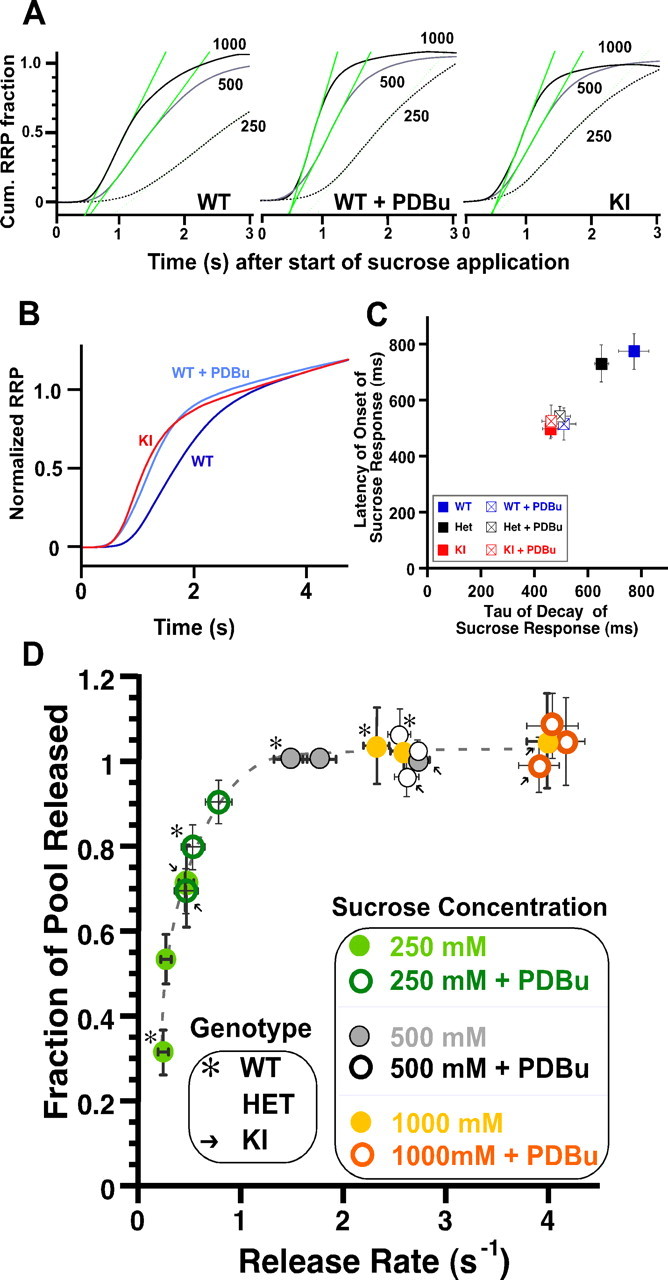
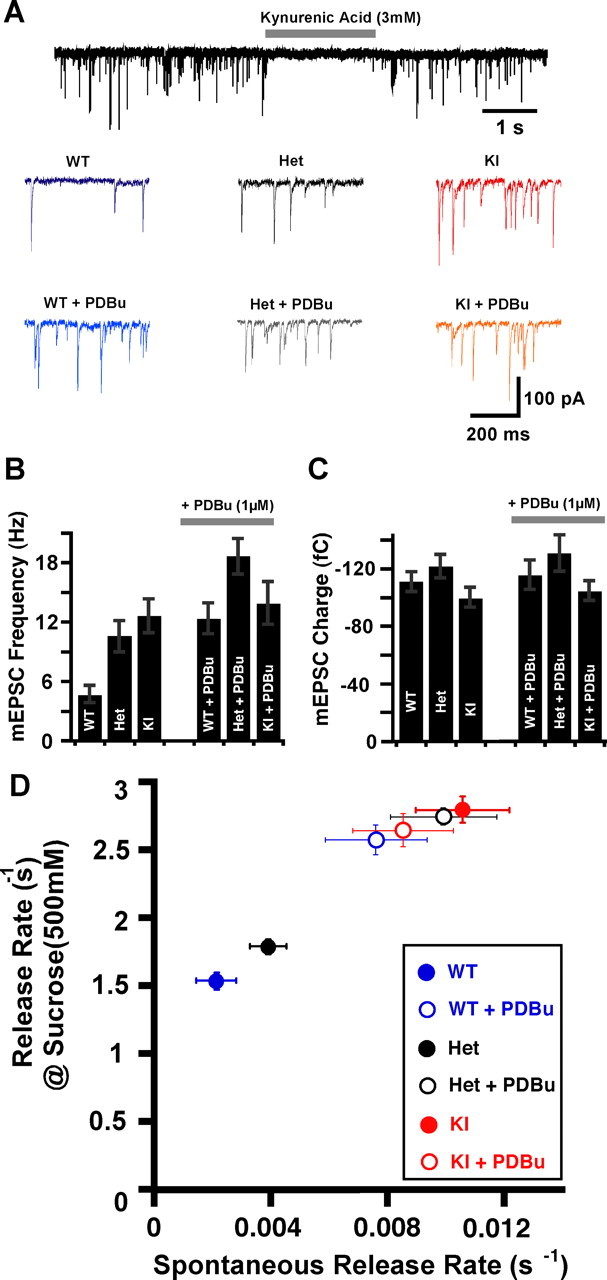
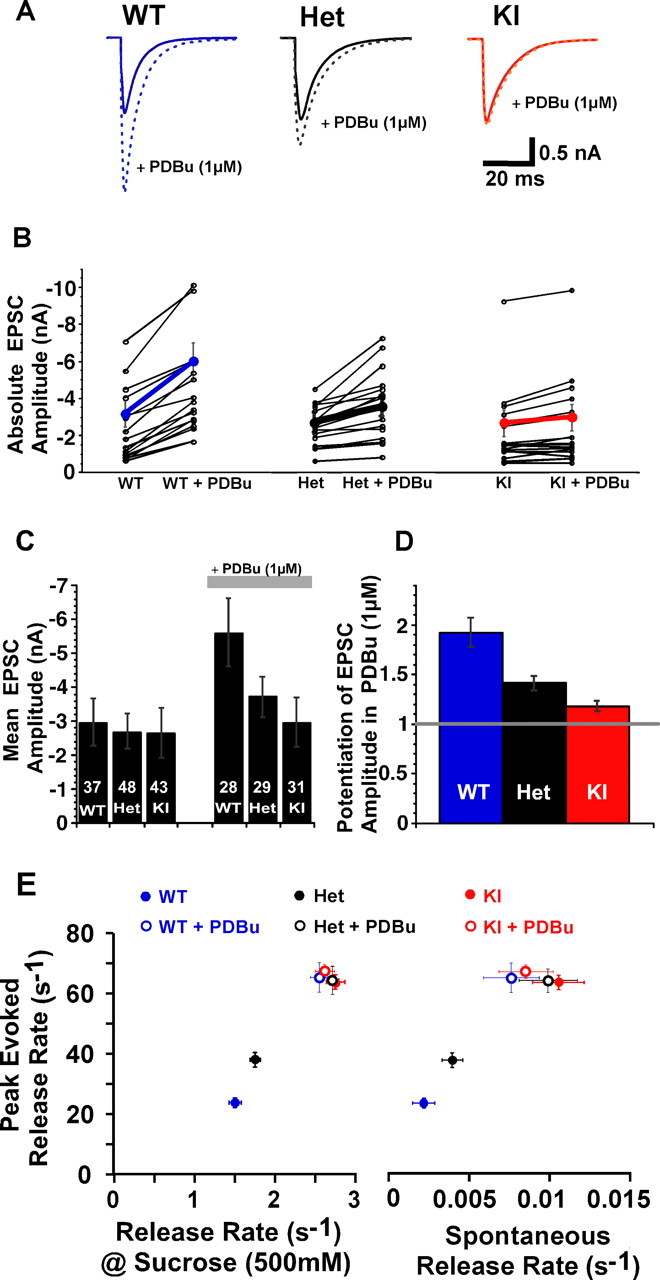
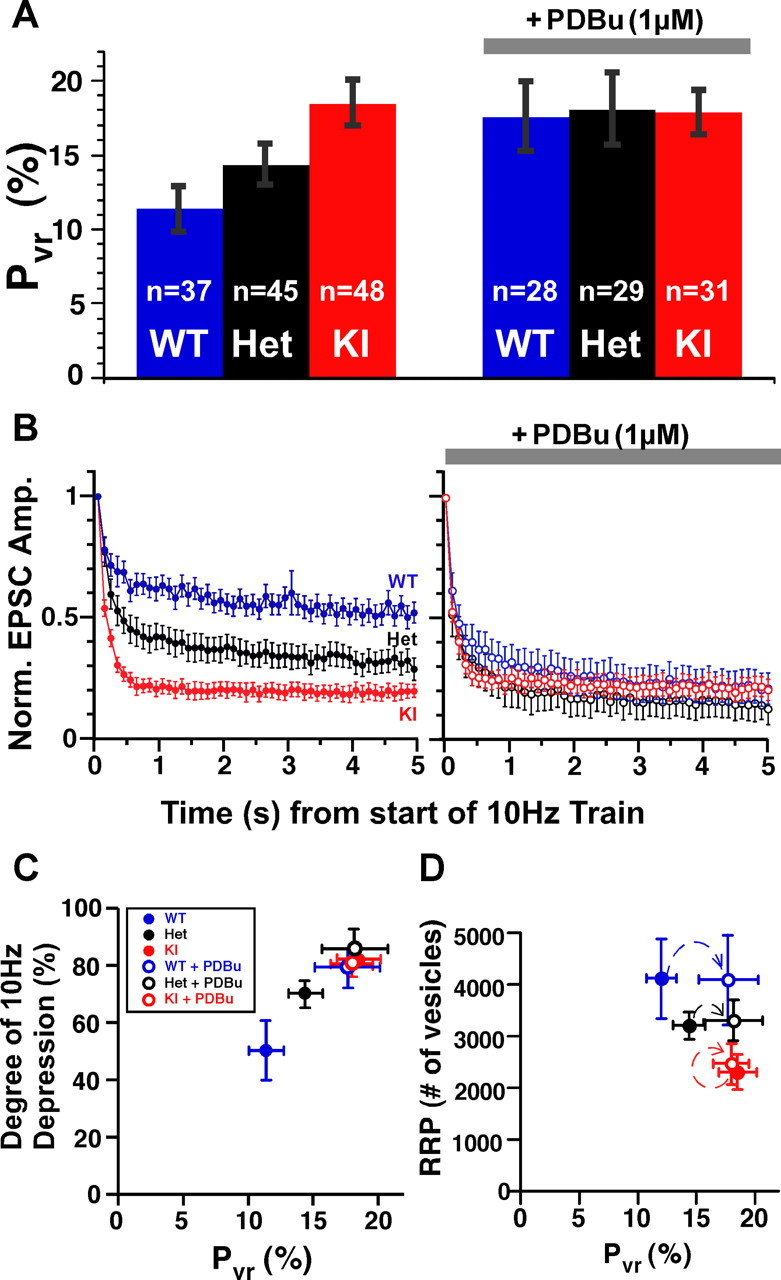
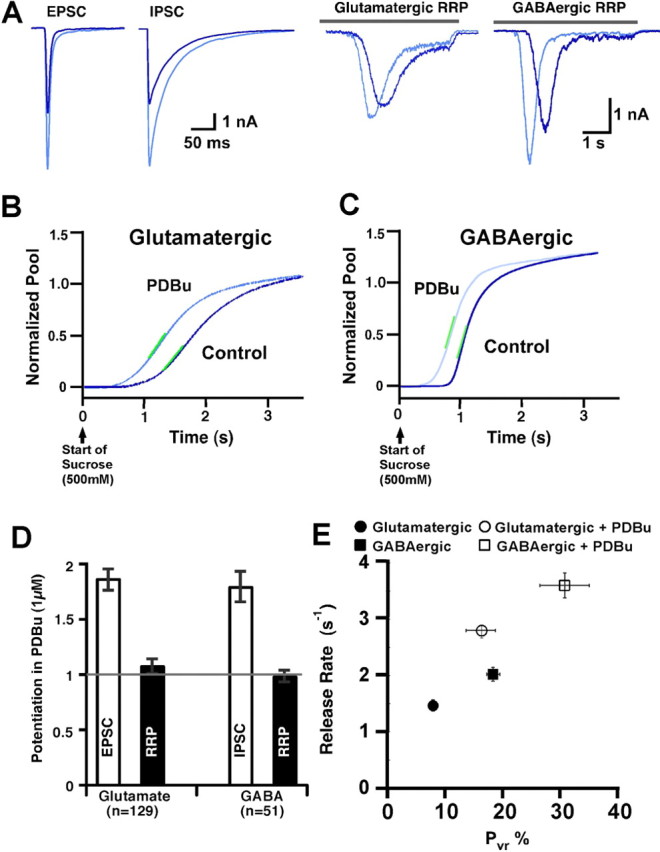
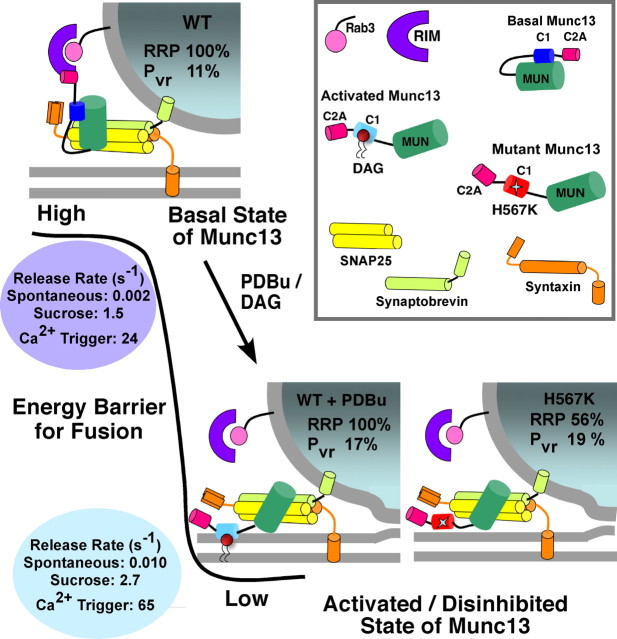
Synapses need to encode a wide dynamic range of action potential frequencies. Essential vesicle priming proteins of the Munc13 (mammalian Unc13) family play an important role in adapting vesicle supply to variable demand and thus influence short-term plasticity characteristics and synaptic function. Structure-function analyses of Munc13s have identified a "catalytic" C-terminal domain and several N-terminal modulatory domains, including a diacylglycerol/phorbol ester [4beta-phorbol-12, 13-dibutyrate (PDBu)] binding C1 domain. Although still allowing basal priming, a Munc13-1 C1 domain mutation (H567K) prevents PDBu induced potentiation of evoked transmitter release, leads to strong depression during trains of synaptic activity, and causes perinatal lethality in mice. To understand the mechanism of C1 domain-mediated modulation of Munc13 function, we examined how PDBu increases neurotransmitter release. Analyses of osmotically induced release as well as Ca2+ triggered and spontaneous release showed that PDBu increases the vesicular release rate without affecting the size of the readily releasable vesicle pool, linking C1 domain activation to a lowering of the energy barrier for vesicle fusion. PDBu binding-deficient mutant Munc13-1(H567K) synapses mirrored the vesicular release properties of PDBu-potentiated wild-type synapses, indicating that Munc13-1(H567K) is a gain-of-function mutant, which conformationally mimics the PDBu-activated state of Munc13-1. We propose a PKC analogous two-state model of regulation of Munc13s, in which the basal state of Munc13s is disinhibited by C1 domain activation into a state of facilitated vesicle release, regardless of whether the release is spontaneous or action potential triggered.


Figures

Figure 1.
Figure 1.
PDBu-mediated C1 domain activation does not affect the pool size. A, Exemplary raw traces of responses to 250 mm (left), 500 mm (middle), and 1000 mm (right) sucrose pulses in naive and PDBu (1 μm)-treated hippocampal autaptic neurons from Munc13-1 WT (dark blue), WT + PDBu (light blue), and Munc13-1H567K KI (red) mice. Gray bar above each trace indicates the duration of sucrose application. B, Distribution of charge of the inward transient response to a 5 s application of 500 mm sucrose, in the presence and absence of PDBu in 19 individual neurons from WT (left), Het (middle), and KI (right) groups. Thick lines indicate the mean values for WT in blue, Het in black, and KI in red. C, Bar plot showing the mean number of vesicles in the RRP calculated by dividing the charge of the sucrose (500 mm) inward transient by the corresponding mEPSC charge. The number of cells is indicated in white above each corresponding group. Error bars in this and the following figures indicate the SEM. D, Potentiation of response charge during PDBu application at 250, 500, and 1000 mm sucrose stimuli.
Figure 2.
Figure 2.
C1 domain activation and H567K mutation increase osmotically induced vesicular release rates. A, Inverted mean current integrals for the three gradients of sucrose (1000 mm in black solid, 500 mm in gray solid, and 250 mm in black dotted lines) in WT (left), WT + PDBu (middle), and KI (right) normalized by their respective RRPs. The green lines depict the maximum slopes signifying the rate of release (s−1) induced by that concentration of sucrose. B, Average normalized current integrals showing the release time course of the RRP during 500 mm sucrose applications in WT (dark blue), WT + PDBu (light blue), and KI (red). C, Correlation between time constant of decay of the sucrose (500 mm) response and latency of onset of the response from the start of sucrose application. D, Summary plot of the fraction of RRP released as a function of the maximal vesicular release rates. Data are from the three genotypes (WT marked with *, n = 22; Het unmarked, n = 23; and KI marked with →, n = 19) with (open symbols) or without (filled symbols) 1 μm PDBu present and at the three sucrose concentrations 250 mm (green), 500 mm (gray), and 1000 mm (orange). All values are normalized to the RRP size (as defined by the response to 500 mm sucrose in the absence of PDBu) to determine the fraction of the pool released. Note that the data for C1 domain activation appears to mimic a virtual increase in hypertonic pressure, indicating an increased responsiveness to the stimuli.
Figure 3.
Figure 3.
Increase in the frequency and rate of release of spontaneous events during C1 activation. A, Top, Trace showing the 10 s mEPSC acquisition protocol with a 2 s period of kynurenic acid (3 mm) for background noise detection. Bottom, A 500 ms span of raw traces showing the spontaneous activity in the three genotypes WT (blue), Het (black), and KI (red) and in the presence of PDBu (light blue, gray, and orange, respectively). B, Bar plot of absolute mEPSC frequencies in KI, Het, and KI without (left) and with (right) PDBu present. C, mEPSC charge in the same groups and conditions as in B. Charge released during a single spontaneous event (n = 40, WT; n = 55, Het; n = 49, KI; n = 28, WT + PDBu; n = 29, Het + PDBu; and n = 31, KI + PDBu). D, Strong correlation between spontaneous release rate and 500 mm sucrose maximal induced release rate in the three groups and two conditions.
Figure 4.
Figure 4.
C1 domain activation increases the rates of all forms of release. A, Exemplary EPSC traces from WT (blue), Het (black), and KI (red) groups and the effect of PDBu (dotted lines). B, Scatter plot of 19 individual neurons. C, D, Bar plots of PDBu-induced potentiation of EPSCs. The absolute amplitudes in naive neurons from the three groups are identical (C, left). E, Correlation of vesicular release rates during all the three forms of release: Ca2+ evoked (y-axis), 500 mm sucrose induced (x-axis, left), and spontaneous (x-axis, right). The peak evoked release rate was calculated by deconvolution of individual EPSC responses by their corresponding mEPSCs after normalizing the EPSC by the RRP of that cell. The osmotically induced release rate was derived from the mean of the maximum slope of 500 mm sucrose response integrals normalized by the corresponding RRP and corrected for by taking into account the fraction of the pool already depleted at the peak of the response. Spontaneous release rate was obtained from the average ratio of the frequency of mEPSCs of each cell to its RRP.
Figure 5.
Figure 5.
Munc13-1 C1 domain increases vesicular release probability. A, Bar plot quantifying the vesicular release probability (Pvr, percentage) showing that the activation of the C1 domain and H567K mutation lead to an increased Pvr. The KI mutant does not show any additional increase in Pvr during PDBu treatment. B, Normalized synaptic responses from wild-type (blue), heterozygote (black), and KI mutant (red) neurons during 10 Hz spike train (5 s) in the absence (left, filled circles) and presence (right, open circles) of PDBu (1 μm). C, Plot of the degree of depression during the 10 Hz spike train as a function of Pvr for each group examined in the presence and absence of PDBu. D, Plot of RRP size versus Pvr before (filled symbols) and after (open symbols) PDBu application. D, Same groups as in C.
Figure 6.
Figure 6.
Comparison of release rates between glutamatergic and GABAergic hippocampal neurons. A, Typical raw traces of evoked (left) and 500 mm sucrose-induced (right) responses from wild-type glutamatergic and GABAergic neurons in the absence and presence of PDBu (1 μm). Average normalized sucrose response integrals from excitatory (B) and inhibitory (C) neurons from control (dark blue) to PDBu-treated (light blue) conditions. Note the faster basal release kinetics in the inhibitory neurons. E, Bar plot of PSC potentiation and the lack of potentiation of RRP in glutamatergic (n = 129) and GABAergic (n = 51) hippocampal neurons. E, Plot correlating the mean peak rate of vesicular release induced by 500 mm sucrose in hippocampal excitatory glutamatergic (circles) and inhibitory GABAergic (squares) autapses as a function of their average Pvr in their naive (filled symbols) and C1 domain-activated (open symbols) states.
Figure 7.
Figure 7.
A two-state model for Munc13 activity. In the naive wild-type synapses, Munc13 exists in a folded configuration (top) in which intramolecular interactions between the N and C termini sterically interfere with the catalytic MUN domain. Such a basal “inhibited” state of Munc13 limits the vesicular release probability and rates by maintaining the energy barrier for fusion at a high level (shown in black). Interaction of Munc13 C2A with the RIM/Rab3 complex may have a stabilizing effect on the priming state. During binding of C1 domain with DAG/PDBu, the Munc13 molecule undergoes a conformational change that disrupts the intramolecular interactions and releases the catalytic domain from its inhibited condition to an activated state. The activation of Munc13 lowers the energy threshold for vesicular fusion, resulting in a potentiation of the kinetics of all forms of Ca2+ -dependent and -independent release. This process of enhancing the fusion willingness of vesicles comes at a stage after priming, possibly via downstream interactions of the MUN domain and the SNARE complex, and therefore impacts fusion probability without changing the RRP size. The Munc13-1H567K mutation leads to release probability and release rates in neurons that mimic the values observed in the C1 domain-activated WT, strongly suggesting that this gain-of-function mutation is a conformational mimic of the disinhibited “activated” state of Munc13. The constitutively open conformation may also have a negative impact on the upstream RIM/Rab3 interaction that normally helps in vesicle priming.

Similar articles

Cited by

References

    1. Andrews-Zwilling YS, Kawabe H, Reim K, Varoqueaux F, Brose N. Binding to Rab3A-interacting molecule RIM regulates the presynaptic recruitment of Munc13-1 and ubMunc13-2. J Biol Chem. 2006;281:19720–19731. - PubMed
    1. Aravamudan B, Fergestad T, Davis WS, Rodesch CK, Broadie K. Drosophila UNC-13 is essential for synaptic transmission. Nat Neurosci. 1999;2:965–971. - PubMed
    1. Ashery U, Varoqueaux F, Voets T, Betz A, Thakur P, Koch H, Neher E, Brose N, Rettig J. Munc13-1 acts as a priming factor for large dense-core vesicles in bovine chromaffin cells. EMBO J. 2000;19:3586–3596. - PMC - PubMed
    1. Augustin I, Rosenmund C, Südhof TC, Brose N. Munc13-1 is essential for fusion competence of glutamatergic synaptic vesicles. Nature. 1999;400:457–461. - PubMed
    1. Basu J, Shen N, Dulubova I, Lu J, Guan R, Guryev O, Grishin NV, Rosenmund C, Rizo J. A minimal domain responsible for Munc13 activity. Nat Struct Mol Biol. 2005;12:1017–1018. - PubMed

Publication types

MeSH terms