. 2007 Feb 6;104(6):1877-82.
doi: 10.1073/pnas.0610575104. Epub 2007 Jan 31.

Synthetic cooperation in engineered yeast populations

Affiliations

Synthetic cooperation in engineered yeast populations

Wenying Shou et al. Proc Natl Acad Sci U S A. .

Abstract

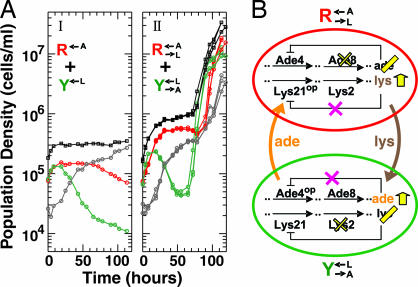
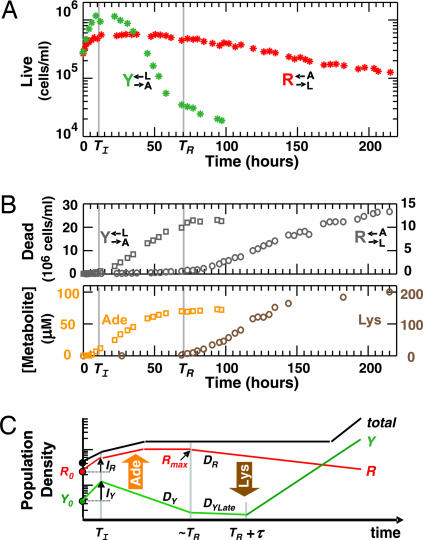
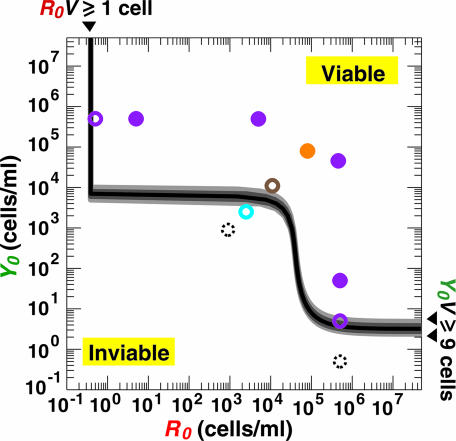
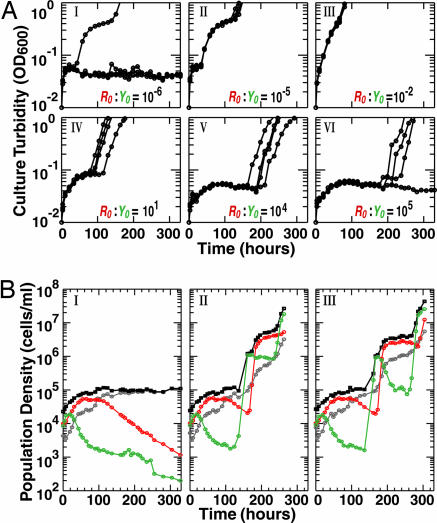
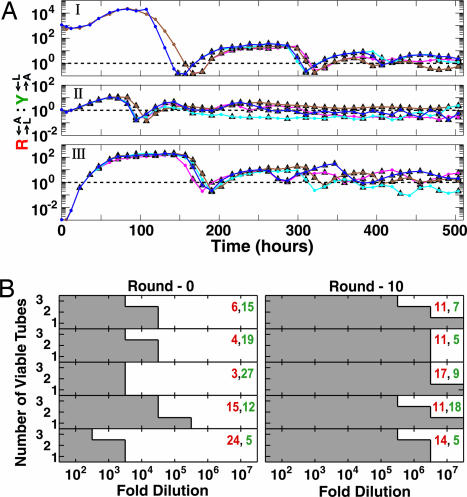
Cooperative interactions are key to diverse biological phenomena ranging from multicellularity to mutualism. Such diversity makes the ability to create and control cooperation desirable for potential applications in areas as varied as agriculture, pollutant treatment, and medicine. Here we show that persistent cooperation can be engineered by introducing a small set of genetic modifications into previously noninteracting cell populations. Specifically, we report the construction of a synthetic obligatory cooperative system, termed CoSMO (cooperation that is synthetic and mutually obligatory), which consists of a pair of nonmating yeast strains, each supplying an essential metabolite to the other strain. The behavior of the two strains in isolation, however, revealed unintended constraints that restrict cooperation, such as asymmetry in starvation tolerance and delays in nutrient release until near cell death. However, the joint system is shown mathematically and experimentally to be viable over a wide range of initial conditions, with oscillating population ratio settling to a value predicted by nutrient supply and consumption. Unexpectedly, even in the absence of explicitly engineered mechanisms to stabilize cooperation, the cooperative system can consistently develop increased ability to survive reductions in population density. Extending synthetic biology from the design of genetic circuits to the engineering of ecological interactions, CoSMO provides a quantitative system for linking processes at the cellular level to the collective behavior at the system level, as well as a genetically tractable system for studying the evolution of cooperation.


Conflict of interest statement

The authors declare no conflict of interest.

Figures

Fig. 1.
Fig. 1.
Rational design of CoSMO. (A) Overproduction of metabolites is required for viable cooperation. At time 0, monocultures of indicated strains grown in synthetic dextrose medium (SD) with the required adenine or lysine supplement (37) were washed free of supplements and mixed. Plots show population dynamics of fluorescent live R (red), fluorescent live Y (green), nonfluorescent dead (gray), and total (black) cells of the coculture as measured by flow cytometry (Methods). (II) Data from three replicate cultures are superimposed. (B) The “wiring” diagram of CoSMO. CoSMO consists of two yeast strains: R→L←A, which lacks Ade8 enzyme and harbors Lys21op enzyme, and Y→A←L, which lacks Lys2 enzyme and harbors Ade4op enzyme. Cells lacking Ade8 (Lys2) cannot synthesize adenine (lysine) and therefore require intake () of the corresponding metabolite. Ade4op and Lys21op are no longer sensitive to end-product feed-back inhibition and consequently overproduce (op) the corresponding metabolite that is eventually released () into the medium (25, 26). Crosses represent genetic inactivation; yellow bars and arrows represent losses and gains in metabolite synthesis, respectively.
Fig. 2.
Fig. 2.
Characterization of individual strains in monocultures and deduction of CoSMO growth pattern. (A and B) Asymmetry in starvation tolerance between two strains and delayed metabolite release. At time 0, monocultures of the two strains grown in the presence of the required supplement were washed free of the supplement. (A) Live population density over time for an initial population density of ≈3 × 10⁵ cells per ml. (B) Dead population density (Upper) and the concentration of lysine or adenine released into the medium over time (Lower) as measured by a bioassay (Methods) for an initial population density of ≈6 × 10⁶ cells per ml. The left and right scales are for experiments on Y→A←L (squares) and R→L←A (circles), respectively. Gray vertical lines mark the time TI when residual growth ends and the time TR when R→L←A enters death phase and releases lysine. (C) A schematic diagram of the initial stage of CoSMO growth deduced from A and B. R and Y denote live population densities of R→L←A and Y→A←L, respectively. Their initial values R0 and Y0 increase IR- and IY-fold, respectively, during residual growth until time TI. After TI, adenine released from dying Y→A←L enables growth of R→L←A. By time ≈TR, most of the Y→A←L population has died and R is at a local maximum Rmax. Lysine is subsequently released from dying R→L←A, and at some time τ after TR, results in an increase in Y under conditions that permit CoSMO viability. The death rate for R→L←A after TR is DR, and for Y→A←L is DY from TI to TR and DYLate from TR onward. The total cell density, which is the sum of R, Y, and dead populations, consequently takes on a pattern of “rise-plateau-rise,” with each rise resulting from net growth of at least one partner.
Fig. 3.
Fig. 3.
Phase diagram for CoSMO viability. The domain of viability for CoSMO at volume V of 2.6 ml is bounded by a black vertical line (single arrowhead, Appendix, inequality 6) and gray curves (Appendix, Inequality 8, with IY set to different values in the experimentally observed range from 2 to 4). The shoulder (⌉) represents the viability threshold imposed by the density requirement alone (Appendix, Eqs. 4 and 5) and is therefore not affected by the culture volume. Different volumes affect only the black vertical line (single arrowhead) and the horizontal asymptote (double arrowhead), which shift along the R0 and Y0 axis according to the initial-number requirements expressed in Appendix inequalities 6 and 8a, respectively. Circles indicate values of (R0, Y0) corresponding to different experiments (orange for Fig. 1AII; purple from top left to bottom right for Fig. 4A, from I to VI; and brown for Fig. 4B). In experiment marked with cyan, one of five replicate cultures was viable (time series not shown); in experiments marked with black, zero of four or five replicate cultures was viable (time series not shown). Overall, the viability–inviability outcome of replicate CoSMO cultures close to the calculated boundary is highly variable (open circles), whereas cultures significantly above and below the boundary show 100% viability (filled circles) and 0% viability (broken circles), respectively.
Fig. 4.
Fig. 4.
Viability of CoSMO. Monocultures of the two strains were washed free of adenine and lysine, and mixed at time 0. (A) CoSMO is viable under a wide range of initial partner ratios. The two strains were mixed at the indicated R→L←A:Y→A←L ratios (R0:Y0) and at the same total initial cell density and culture volume (≈5 × 10⁵ cells per ml × 2.6 ml = 1.3 × 10⁶ cells per culture, four replicate cultures per condition). Plots show culture turbidity in OD600 (optical density at 600 nm) over time. OD600 of 1 corresponds to a population density from 1 × 10⁷ to 5 × 10⁷ cells per ml depending on the cell size. (B) Stochastic CoSMO behavior close to the initial-density requirement. Three replicate cultures (≥20 ml) were set up at 1.1 × 10⁴ cells per ml per strain. Plots show the dynamics of live R→L←A (red), live Y→A←L (green), dead (gray), and total (black) cell densities. One of the cultures was inviable (I), whereas the other two were viable (II and III).
Fig. 5.
Fig. 5.
Long-term changes in CoSMO. (A) Stabilization of partner ratios. At time 0, duplicate CoSMO cultures (brown and blue) were initiated at OD600 of 0.01 (4.7 × 10⁵ total cells per ml) and R→L←A:Y→A←L ratios of 103 (I), 1 (II), and 10−3 (III). When OD600 exceeded the set point of 0.06 for the first time, two 3-ml samples were taken from each culture (brown and magenta from the brown; blue and cyan from the blue), and thereafter diluted once per day (magenta and cyan) or twice per day (brown and blue) to the set point. A low set point was chosen so that nutrients other than adenine and lysine were not limiting. Plots show R→L←A:Y→A←L ratios over time, with triangles marking points of dilution. (B) Increased ability to survive reductions in population density. Five 2.6-ml CoSMO cultures, initiated at different partner ratios, were grown to near-saturation and used as Round-0 cultures for five independent series. After 10 rounds of dilution and regrowth in 2.6 ml, a near-saturation Round-10 culture was obtained for each series. Each row corresponds to a particular series and depicts the number of tubes (of three) that were viable at indicated dilutions for Round-0 (Left) and Round-10 (Right) cultures. Population densities of R→L←A (red) and Y→A←L (green) in million cells per ml for Round-0 and Round-10 cultures are shown in the Inset.

Comment in

  • Synthetic ecology: a model system for cooperation.
    Dunham MJ. Dunham MJ. Proc Natl Acad Sci U S A. 2007 Feb 6;104(6):1741-2. doi: 10.1073/pnas.0611067104. Epub 2007 Jan 31. Proc Natl Acad Sci U S A. 2007. PMID: 17267618 Free PMC article. No abstract available.

References

    1. Hanahan D, Folkman J. Cell. 1996;86:353–364. - PubMed
    1. Boucher DH. The Biology of Mutualism: Ecology and Evolution. New York: Oxford Univ Press; 1985.
    1. Bergstrom CT, Bronstein JL, Bshary R, Connor RC, Daly M, Frank SA, Gintis H, Keller L, Leimar O, Noe R, Queller DC. In: Genetic and Cultural Evolution of Cooperation. Hammerstein P, editor. Boston: MIT Press; 2002.
    1. Rainey PB, Rainey K. Nature. 2003;425:72–74. - PubMed
    1. Buchsbaum R, Buchsbaum M. Science. 1934;80:408–409. - PubMed

Publication types

MeSH terms