Comparative Study
. 2007 Feb 6;104(6):1883-8.
doi: 10.1073/pnas.0604851104. Epub 2007 Jan 31.

Genome dynamics in a natural archaeal population

Affiliations
Comparative Study

Genome dynamics in a natural archaeal population

Eric E Allen et al. Proc Natl Acad Sci U S A. .

Abstract

Evolutionary processes that give rise to, and limit, diversification within strain populations can be deduced from the form and distribution of genomic heterogeneity. The extent of genomic change that distinguishes the acidophilic archaeon Ferroplasma acidarmanus fer1 from an environmental population of the same species from the same site, fer1(env), was determined by comparing the 1.94-megabase (Mb) genome sequence of the isolate with that reconstructed from 8 Mb of environmental sequence data. The fer1(env) composite sequence sampled approximately 92% of the isolate genome. Environmental sequence data were also analyzed to reveal genomic heterogeneity within the coexisting, coevolving fer1(env) population. Analyses revealed that transposase movement and the insertion and loss of blocks of novel genes of probable phage origin occur rapidly enough to give rise to heterogeneity in gene content within the local population. Because the environmental DNA was derived from many closely related individuals, it was possible to quantify gene sequence variability within the population. All but a few gene variants show evidence of strong purifying selection. Based on the small number of distinct sequence types and their distribution, we infer that the population is undergoing frequent genetic recombination, resulting in a mosaic genome pool that is shaped by selection. The larger genetic potential of the population relative to individuals within it and the combinatorial process that results in many closely related genome types may provide the basis for adaptation to environmental fluctuations.


Conflict of interest statement

The authors declare no conflict of interest.

Figures

Fig. 1.
Fig. 1.
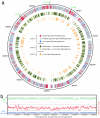
Isolate versus environmental population genome comparison. (a) Circular diagram of the F. acidarmanus fer1 genome. Progressing inward: double line shows predicted gene sequences color-coded according to functional category (see SI Fig. 6); fer1(env) genome reconstruction (blue circle); putative regions impacted by integrated elements in fer1 and fer1(env) (red and pink, respectively); unique fer1 and fer1(env) genes (dark and light green, respectively); transposases (tnps) in fer1 and fer1(env) (dark and light gray, respectively). Inner circle shows % G+C content in fer1 (window size 8 kb). (b) Dot plot showing the shared synteny between assembled genomic fragments of the fer1(env) composite genome sequence and the fer1 isolate genome. Circled regions show the 25 rearranged transposase genes (opposite strand orientation in green) and arrows denote regions of fer1-specific phage elements.
Fig. 2.
Fig. 2.
Example of a heteromorphic fer1(env) genomic region that includes a type I restriction-modification system (M, methylation; S, specificity; R, restriction) that is present in only a subset of fer1(env) members, and is distinct from the comparable region in fer1. The 24-gene insertion in fer1 (shown in red) includes a phage integrase, four hypothetical genes, a phage-related DNA primase, 13 hypothetical proteins, another phage integrase, a conserved hypothetical membrane protein, a site-specific DNA methylase, and a hypothetical protein. The insertion region is 3′ delimited by a tRNALeu.
Fig. 3.
Fig. 3.
Range of sequence types observed in the fer1(env) environmental population. Isolate-type sequences are shown in gray; env-type sequences are shown in yellow. Sequence types were quantified for all fer1(env) loci; see also Fig. 4 and SI Fig. 9.
Fig. 4.
Fig. 4.
Form and distribution of sequence-type variation within the fer1(env) population. (a) Circular diagram showing the genome-wide distribution of sequence variation in the fer1(env) population. Data are derived from the gene content dendogram (SI Fig. 9). Each fer1(env) locus was queried with respect to sequence type present (isolate-type only, isolate plus env-type, or env-type only) by alignment of environmental sequencing reads constituting the fer1(env) population to the orthologous fer1 locus. Isolate-type-only sequences were defined as having an environmental nucleotide identity ≥99.9% to the respective fer1 sequence. Genes <99.9% similar to the fer1 sequence were defined as having env-type sequence. Homogeneous loci represent those possessing a single sequence type; isolate-type only (red) or 1 env-type only (blue). Cumulative heterogeneous loci (gray) possess both isolate-type plus env-type sequences or multiple (>1) env-type sequences, which can be further separated by the sequence composition of those loci (brown, light brown, or orange). The locations of 23S, 16S, and 5S rRNA genes are shown for reference. Segment spanning the two asterisks (*) shows region depicted in Fig. 5. (b) Percentage identity (green), depth of coverage (10-kb window size) (red), and tiling coverage (blue) of fer1(env) reads across the fer1 genome.
Fig. 5.
Fig. 5.
Detailed view of fer1(env) population structure. (a) Genomic region (109 genes) showing the distribution of sequence variability and mosaic structure of the fer1(env) population. The majority of loci possess more than one sequence type, and the fer1 isolate sequence type is present at most loci (red plus gray). Note that env-only type genes (blue) may be homogeneous or heterogeneous depending on the number of allelic variants present. (b) An enlargement of a region in a illustrating the sampling of environmental sequence types across 11 genes. Individual sequencing reads constituting the region are shown. Note that the sequence at one end of a paired-end clone may be isolate type whereas the other end may be non-isolate type. Example of recombination site (env- to isolate-type sequence) occurring within reads is noted (*).

Similar articles

Cited by

References

    1. Bhattacharyya A, Stilwagen S, Ivanova N, D'Souza M, Bernal A, Lykidis A, Kapatral V, Anderson I, Larsen N, Los T, et al. Proc Natl Acad Sci USA. 2002;99:12403–12408. - PMC - PubMed
    1. Nelson KE, Fouts DE, Mongodin EF, Ravel J, DeBoy RT, Kolonay JF, Rasko DA, Angiuoli SV, Gill SR, Paulsen IT, et al. Nucleic Acids Res. 2004;32:2386–2395. - PMC - PubMed
    1. Eppinger M, Baar C, Raddatz G, Huson DH, Schuster SC. Nat Rev Microbiol. 2004;2:872–885. - PubMed
    1. Holden MT, Titball RW, Peacock SJ, Cerdeno-Tarraga AM, Atkins T, Crossman LC, Pitt T, Churcher C, Mungall K, Bentley SD, et al. Proc Natl Acad Sci USA. 2004;101:9786–9791. - PubMed
    1. Deng W, Burland V, Plunkett G, III, Boutin A, Mayhew GF, Liss P, Perna NT, Rose DJ, Mau B, Zhou S, et al. J Bacteriol. 2002;184:4601–4611. - PMC - PubMed

Publication types

LinkOut - more resources