Comparative Study
. 2007 Mar;17(3):358-67.
doi: 10.1101/gr.5750507. Epub 2007 Jan 31.

Refinement and expansion of signaling pathways: the osmotic response network in yeast

Affiliations
Comparative Study

Refinement and expansion of signaling pathways: the osmotic response network in yeast

Irit Gat-Viks et al. Genome Res. 2007 Mar.

Abstract

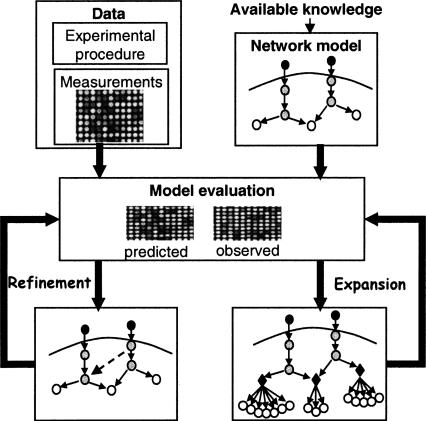
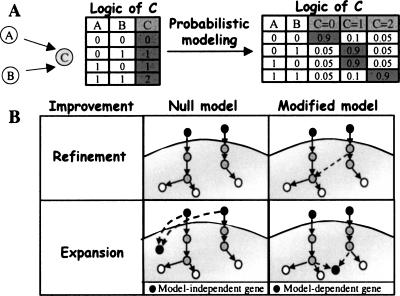
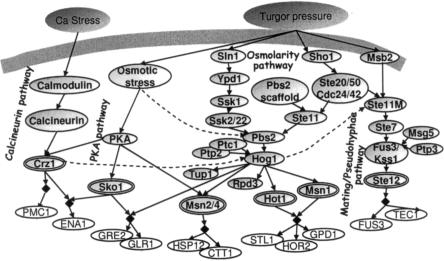
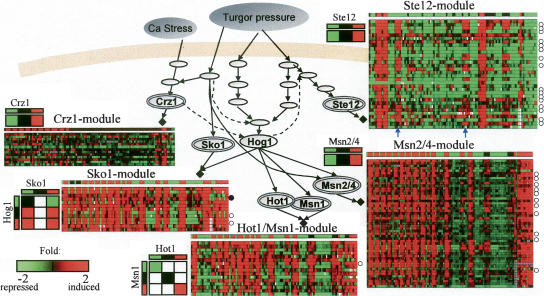
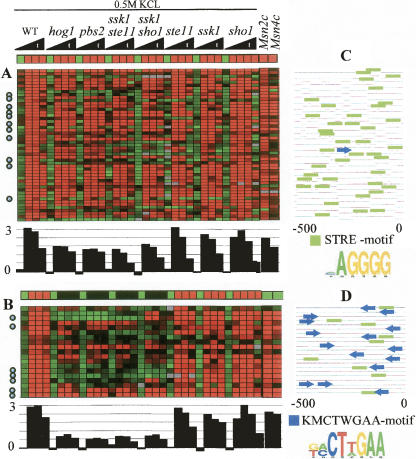
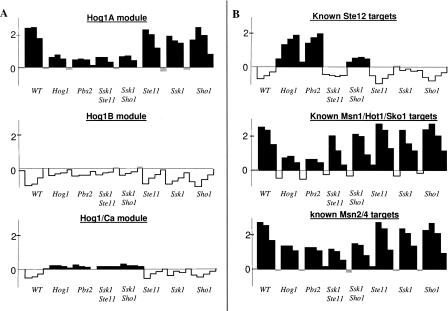
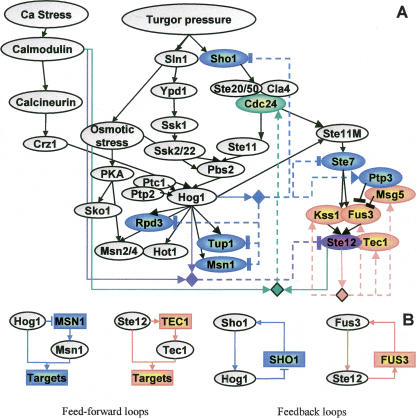
The analysis of large-scale genome-wide experiments carries the promise of dramatically broadening our understanding on biological networks. The challenge of systematic integration of experimental results with established biological knowledge on a pathway is still unanswered. Here we present a methodology that attempts to answer this challenge when investigating signaling pathways. We formalize existing qualitative knowledge as a probabilistic model that depicts known interactions between molecules (genes, proteins, etc.) as a network and known regulatory relations as logics. We present algorithms that analyze experimental results (e.g., transcription profiles) vis-à-vis the model and propose improvements to the model based on the fit to the experimental data. These algorithms refine the relations between model components, as well as expand the model to include new components that are regulated by components of the original network. Using our methodology, we have modeled together the knowledge on four established signaling pathways related to osmotic shock response in Saccharomyces cerevisiae. Using over 100 published transcription profiles, our refinement methodology revealed three cross talks in the network. The expansion procedure identified with high confidence large groups of genes that are coregulated by transcription factors from the original network via a common logic. The results reveal a novel delicate repressive effect of the HOG pathway on many transcriptional target genes and suggest an unexpected alternative functional mode of the MAP kinase Hog1. These results demonstrate that, by integrated analysis of data and of well-defined knowledge, one can generate concrete biological hypotheses about signaling cascades and their downstream regulatory programs.


Figures

Figure 1.
Figure 1.
Overview of the model improvement methodology. Model formalization: The current qualitative knowledge on the studied biological system is formalized as a Bayesian network (top right; see also Fig. 2). The illustrated model contains several molecular types: environmental stimulations (dark gray), signaling proteins and transcription factors (light gray), and mRNAs (white). The refinement and expansion procedures take as input the network model and high throughput measurements on network's components (top left), and search systematically for model improvements that maximize a probabilistic improvement score. The score measures the increase of fit between the model predictions and the observed data. The model refinement procedure (middle left) seeks structural and logical changes in existing model components, which attain the best score. Structural refinements are marked by dashed connections. The model expansion procedure (middle right) assigns systematically new target genes to regulatory modules, based on their fit to the predicted expression of the module. In the illustration, three regulatory modules were formed. They contain known and novel target genes (white circles). All genes in the same module share the same logic (black diamonds).
Figure 2.
Figure 2.
The computational approach. (A) Modeling the current knowledge. Nodes represent the variables of the model and arcs are known regulatory relations. Here, the state of variable C depends on the states of its regulators A and B according to a specific logic. In the combinatorial logic of C (left), the state of C is 1 if, and only if, at least one of its regulators has state 1. In the probabilistic modeling (right), each possible state of C is assigned a probability depending on our confidence in the current biological knowledge (here, 90% confidence). (B) Improving the model. The model refinement and expansion procedures look for model changes that improve the model significantly. The improvement score compares between the fit of a possible modified model and that of the null (original) model. The plots are a schematic representation of these two models in cases of refinement (top) and expansion (bottom). In expansion, when adding a new gene, the null model assumes that the gene expression can be explained sufficiently by the environmental stimulation. The alternative hypothesis is a model-dependent gene, i.e., the gene is regulated by our signaling network. We expand the model only if the improvement score is significant, i.e., the signaling network explains the expression much better than the environmental stimulation only.
Figure 3.
Figure 3.
A model of the yeast response to osmotic and calcium stress. The model contains (left to right) the calcineurin pathway, PKA signaling pathway, the HOG MAPK pathway, including its Sln1–Ssk1 and Sho1–Ste11 upstream branches, and the mating/pseudohyphal growth pathways. The network, constructed based on literature reports, contains environmental conditions (dark gray), signaling components (light gray ovals), transcription factors (double ovals) and their transcriptional targets (white ovals). Targets sharing the same regulatory logics (i.e., in the same module) are indicated by black diamonds. Arrows are well-established relations (solid lines) or relations predicted by the refinement procedure (dashed lines). The logic by which each component is governed by its regulators is described in Supplement A. The dual role of the MAPKKK Ste11 in the HOG and mating pathways is formalized by refining two different model variables called Ste11 and Ste11M, respectively.
Figure 4.
Figure 4.
Expansion of the osmotic network model. The expansion algorithm assigns known and novel target genes to known modules (black diamonds). Each module is represented by a matrix showing the expression of its target genes (rows) across the 106 conditions (columns). Known target genes that were assigned to their module correctly/incorrectly are marked with white/black circles to the right of the corresponding row (known targets were excluded from the model before expansion, to allow validation and to avoid circularity). The predicted expression levels in each condition appear as a separate row above the matrix. The logic of each module, obtained by the refinement procedure, appears near the matrix. We show in color only logic entries with significant improvement score. In general, there is high agreement between model predictions and observed levels. The few cases of disagreement (e.g., columns marked by blue arrows in the Ste12 module) highlight our incomplete understanding (and hence modeling) of the biological system. The full details on each module appear in Supplement C, including lists of correct/incorrect target genes, and their sources in the literature.
Figure 5.
Figure 5.
Expression profiles of two modules associated with Msn2/4. (A) The known Msn2/4 module. (B) The novel Hog1A module. The conditions are time series measurements in response to 0.5 M KCl osmotic shock. Below the predicted expression vector and the observed expression matrix (the same presentation as in Fig. 4), the average fold induction of the module is shown. Both modules are hypothesized to be regulated by Msn2/4 and include many known Msn2/4 targets (marked with circles). However, their expression patterns are clearly distinct: The Hog1A module depends much more strongly on the presence of Hog1 in severe osmotic shock. In wild type (WT), the expression level in both modules is ∼3, but in hog1, pbs2, ssk1ste11, and ssk1sho1 the expression levels differ significantly: ∼0.5 in Hog1A and ∼2 in Msn2/4 module (KS-test P-value < 10−4). The two rightmost columns in A and B show the expression level of the modules in Msn2 and Msn4 overexpression mutants. Although the predicted expression in these conditions is low in the Hog1A module, the observed level in both modules is high, indicating that both modules are regulated by Msn2/4. (C,D) Promoter analysis. Each line represents the 500-bp sequence upstream of the transcription start site for the gene in that row. Green boxes represent occurrences of the STRE motif (a known Msn2/4 binding site); blue arrows represent the new motif KMCTWGAA discovered in this analysis. This motif exhibits a non-uniform distribution along the promoter in terms of location and orientation. The novel motif supports the separation of the Msn2/4 targets into two distinct modules.
Figure 6.
Figure 6.
HOG pathway-dependent repression of genes, and multiple functional modes of Hog1. Each plot shows the average fold induction (in log2 scale) of novel gene modules (A) or known targets of TFs (B) in wild type (WT) and seven HOG pathway mutants exposed to 0.5 M KCl. Black/white coloring indicates average fold induction above/below 0.1. (A) The novel modules Hog1A, Hog1B, and Hog1/Ca (the Hog1C and Ssk2/22 modules [data not shown] are similar to Hog1B in this view). (B) The known target genes of Ste12 (KSS1, TEC1, FUS1, FUS3, MSG5, KAR4, CLN1, PGU1), Hog1 (HOR2, GRE2, STL1, ENA1, GLR1, GPD1, HAL1, CHA1, AHP1, YGR043C, YGR052W (reserved name FMP48), YML131W; Hohmann 2002), and Msn2/4 (Rep et al. 2000). Expression of the novel modules Hog1B and Hog1/Ca (A, middle and bottom) increases in the absence of Hog1. Although the whole Hog1-dependent inhibition response is known to be regulated by Ste12, one can clearly see that these novel modules differ significantly from the Ste12 targets (B, top), indicating existence of Hog1-dependent in spite of Ste12-independent inhibition. The known Hog1/Msn1/Sko1 and Msn2/4 targets (B, middle and bottom) have distinct expression pattern (KS-test P-value < 10−5): The Msn1/Hot1/Sko1 targets have higher expression in the ssk1ste11 and ssk1sho1 mutants compared to hog1 and pbs2 mutants, indicating that Hog1 can be activated also by a third additional input. In contrast, the Msn2/4 targets have a similar expression pattern in all four of these mutants, indicating that Hog1 is dependent on the two upstream branches of the HOG pathway. Surprisingly, the novel modules' expression pattern (A) also suggests dependency on the two HOG branches. One can clearly see that two of these modules (Hog1B and Hog1/Ca) differ significantly from the known Msn2/4 targets (the distinction between Msn2/4 and the third module Hog1A is discussed in Fig. 5). Taken together, this suggests that Hog1 has two distinct functional modes that involve a different combination of transcription factors. An extended version of the novel modules appears in Supplement C.
Figure 7.
Figure 7.
Complex transcriptional feedback in the yeast osmotic network model. (A) We highlight in color model variables whose corresponding genes were included in a module. Regulatory units are shown as diamonds, where the incoming arcs indicate the regulators they contain, and outcoming dashed arcs indicate their (direct or indirect) targets. For each regulatory unit, we use a different color for its target genes and the relevant edges. For example, the unit of Ste12 (orange) has TEC1, FUS3, KSS1, and MSG5 among its targets. Unlike previous maps, the same diamond might represent several different regulatory logics, and the arcs distinguish between positive (→) and negative (⫞) feedback. The rich circuitry observed is probably part of the cellular adaptation and provides rapid and transient response to osmotic stress. (B) A few network motifs discovered in A. Rectangles indicate target genes, and ovals are proteins.

Similar articles

Cited by

References

    1. Bar-Joseph Z., Gerber G.K., Lee T.I., Rinaldi N.J., Yoo J.Y., Robert F., Gordon D.B., Fraenkel E., Jaakkola T.S., Young R.A., Gerber G.K., Lee T.I., Rinaldi N.J., Yoo J.Y., Robert F., Gordon D.B., Fraenkel E., Jaakkola T.S., Young R.A., Lee T.I., Rinaldi N.J., Yoo J.Y., Robert F., Gordon D.B., Fraenkel E., Jaakkola T.S., Young R.A., Rinaldi N.J., Yoo J.Y., Robert F., Gordon D.B., Fraenkel E., Jaakkola T.S., Young R.A., Yoo J.Y., Robert F., Gordon D.B., Fraenkel E., Jaakkola T.S., Young R.A., Robert F., Gordon D.B., Fraenkel E., Jaakkola T.S., Young R.A., Gordon D.B., Fraenkel E., Jaakkola T.S., Young R.A., Fraenkel E., Jaakkola T.S., Young R.A., Jaakkola T.S., Young R.A., Young R.A., et al. Computational discovery of gene modules and regulatory networks. Nat. Biotechnol. 2003;21:1337–1342. - PubMed
    1. Beer M.A., Tavazoie S., Tavazoie S. Predicting gene expression from sequence. Cell. 2004;117:185–198. - PubMed
    1. Calvano S.E., Xiao W., Richards D.R., Felciano R.M., Baker H.V., Cho R.J., Chen R.O., Brownstein B.H., Cobb J.P., Tschoeke S.K., Xiao W., Richards D.R., Felciano R.M., Baker H.V., Cho R.J., Chen R.O., Brownstein B.H., Cobb J.P., Tschoeke S.K., Richards D.R., Felciano R.M., Baker H.V., Cho R.J., Chen R.O., Brownstein B.H., Cobb J.P., Tschoeke S.K., Felciano R.M., Baker H.V., Cho R.J., Chen R.O., Brownstein B.H., Cobb J.P., Tschoeke S.K., Baker H.V., Cho R.J., Chen R.O., Brownstein B.H., Cobb J.P., Tschoeke S.K., Cho R.J., Chen R.O., Brownstein B.H., Cobb J.P., Tschoeke S.K., Chen R.O., Brownstein B.H., Cobb J.P., Tschoeke S.K., Brownstein B.H., Cobb J.P., Tschoeke S.K., Cobb J.P., Tschoeke S.K., Tschoeke S.K., et al. A network-based analysis of systemic inflammation in humans. Nature. 2005;437:1032–1037. - PubMed
    1. Covert M.W., Knight E.M., Reed J.L., Herrgard M.J., Palsson B.O., Knight E.M., Reed J.L., Herrgard M.J., Palsson B.O., Reed J.L., Herrgard M.J., Palsson B.O., Herrgard M.J., Palsson B.O., Palsson B.O. Integrating high-throughput and computational data elucidates bacterial networks. Nature. 2004;429:92–96. - PubMed
    1. De Nadal E., Zapater M., Alepuz P.M., Sumoy L., Mas G., Posas F., Zapater M., Alepuz P.M., Sumoy L., Mas G., Posas F., Alepuz P.M., Sumoy L., Mas G., Posas F., Sumoy L., Mas G., Posas F., Mas G., Posas F., Posas F. The MAPK Hog1 recruits Rpd3 histone deacetylase to activate osmoresponsive genes. Nature. 2004;427:370–374. - PubMed

Publication types

MeSH terms

Substances

LinkOut - more resources