

High-resolution copy number analysis of paraffin-embedded archival tissue using SNP BeadArrays
- PMID: 17267813
- PMCID: PMC1800928
- DOI: 10.1101/gr.5686107
High-resolution copy number analysis of paraffin-embedded archival tissue using SNP BeadArrays
Abstract
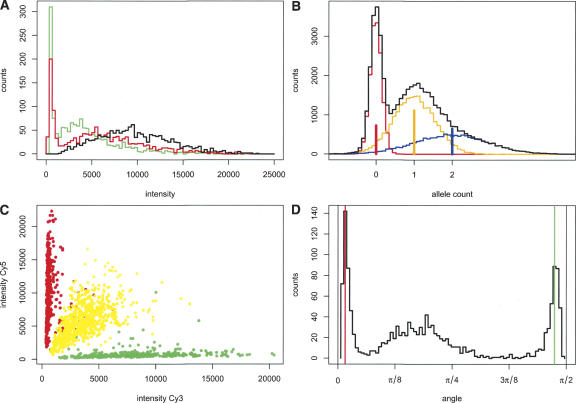
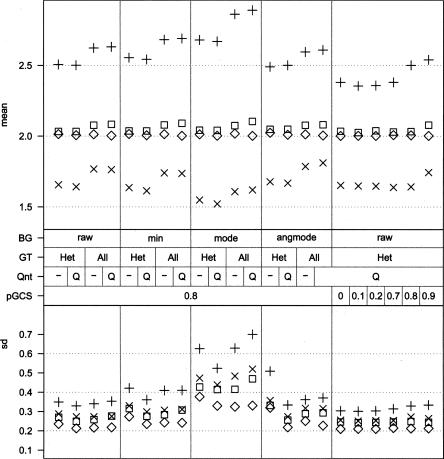
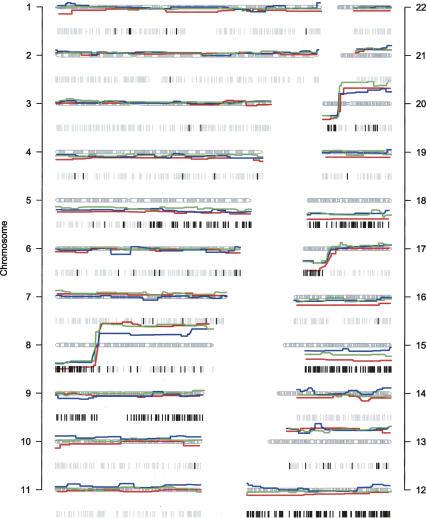
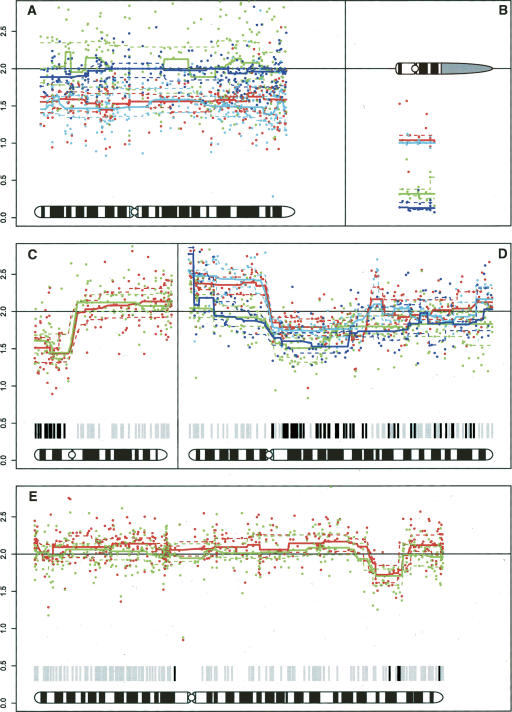
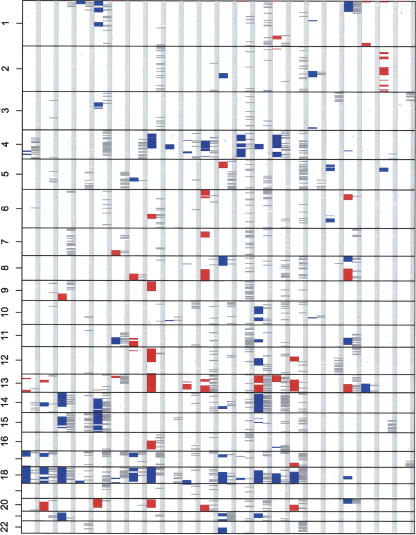
High-density SNP microarrays provide insight into the genomic events that occur in diseases like cancer through their capability to measure both LOH and genomic copy numbers. Where currently available methods are restricted to the use of fresh frozen tissue, we now describe the design and validation of copy number measurements using the Illumina BeadArray platform and the application of this technique to formalin-fixed, paraffin-embedded (FFPE) tissue. In fresh frozen tissue from a set of colorectal tumors with numerous chromosomal aberrations, our method measures copy number patterns that are comparable to values from established platforms, like Affymetrix GeneChip and BAC array-CGH. Moreover, paired comparisons of fresh frozen and FFPE tissues showed nearly identical patterns of genomic change. We conclude that this method enables the use of paraffin-embedded material for research into both LOH and numerical chromosomal abnormalities. These findings make the large pathological archives available for genomic analysis, which could be especially relevant for hereditary disease where fresh material from affected relatives is rarely available.
Figures
References
-
- Bignell G.R., Huang J., Greshock J., Watt S., Butler A., West S., Grigorova M., Jones K.W., Wei W., Stratton M.R., Huang J., Greshock J., Watt S., Butler A., West S., Grigorova M., Jones K.W., Wei W., Stratton M.R., Greshock J., Watt S., Butler A., West S., Grigorova M., Jones K.W., Wei W., Stratton M.R., Watt S., Butler A., West S., Grigorova M., Jones K.W., Wei W., Stratton M.R., Butler A., West S., Grigorova M., Jones K.W., Wei W., Stratton M.R., West S., Grigorova M., Jones K.W., Wei W., Stratton M.R., Grigorova M., Jones K.W., Wei W., Stratton M.R., Jones K.W., Wei W., Stratton M.R., Wei W., Stratton M.R., Stratton M.R., et al. High-resolution analysis of DNA copy number using oligonucleotide microarrays. Genome Res. 2004;14:287–295. - PMC - PubMed
-
- De Jong A.E., van Puijenbroek M., Hendriks Y., Tops C., Wijnen J., Ausems M.G., Meijers-Heijboer H., Wagner A., Van Os T.A., Brocker-Vriends A.H., van Puijenbroek M., Hendriks Y., Tops C., Wijnen J., Ausems M.G., Meijers-Heijboer H., Wagner A., Van Os T.A., Brocker-Vriends A.H., Hendriks Y., Tops C., Wijnen J., Ausems M.G., Meijers-Heijboer H., Wagner A., Van Os T.A., Brocker-Vriends A.H., Tops C., Wijnen J., Ausems M.G., Meijers-Heijboer H., Wagner A., Van Os T.A., Brocker-Vriends A.H., Wijnen J., Ausems M.G., Meijers-Heijboer H., Wagner A., Van Os T.A., Brocker-Vriends A.H., Ausems M.G., Meijers-Heijboer H., Wagner A., Van Os T.A., Brocker-Vriends A.H., Meijers-Heijboer H., Wagner A., Van Os T.A., Brocker-Vriends A.H., Wagner A., Van Os T.A., Brocker-Vriends A.H., Van Os T.A., Brocker-Vriends A.H., Brocker-Vriends A.H., et al. Microsatellite instability, immunohistochemistry, and additional PMS2 staining in suspected hereditary nonpolyposis colorectal cancer. Clin. Cancer Res. 2004;10:972–980. - PubMed
-
- Diep C.B., Kleivi K., Ribeiro F.R., Teixeira M.R., Lindgjaerde O.C., Lothe R.A., Kleivi K., Ribeiro F.R., Teixeira M.R., Lindgjaerde O.C., Lothe R.A., Ribeiro F.R., Teixeira M.R., Lindgjaerde O.C., Lothe R.A., Teixeira M.R., Lindgjaerde O.C., Lothe R.A., Lindgjaerde O.C., Lothe R.A., Lothe R.A. The order of genetic events associated with colorectal cancer progression inferred from meta-analysis of copy number changes. Genes Chromosomes Cancer. 2006;45:31–41. - PubMed
-
- Dumur C.I., Dechsukhum C., Ware J.L., Cofield S.S., Best A.M., Wilkinson D.S., Garrett C.T., Ferreira-Gonzalez A., Dechsukhum C., Ware J.L., Cofield S.S., Best A.M., Wilkinson D.S., Garrett C.T., Ferreira-Gonzalez A., Ware J.L., Cofield S.S., Best A.M., Wilkinson D.S., Garrett C.T., Ferreira-Gonzalez A., Cofield S.S., Best A.M., Wilkinson D.S., Garrett C.T., Ferreira-Gonzalez A., Best A.M., Wilkinson D.S., Garrett C.T., Ferreira-Gonzalez A., Wilkinson D.S., Garrett C.T., Ferreira-Gonzalez A., Garrett C.T., Ferreira-Gonzalez A., Ferreira-Gonzalez A. Genome-wide detection of LOH in prostate cancer using human SNP microarray technology. Genomics. 2003;81:260–269. - PubMed
-
- Eilers P.H., de Menezes R.X., de Menezes R.X. Quantile smoothing of array CGH data. Bioinformatics. 2005;21:1146–1153. - PubMed
Publication types
MeSH terms
LinkOut - more resources
Full Text Sources
Other Literature Sources
Medical
Molecular Biology Databases
Miscellaneous