. 2007 Feb;48(2):295-303.

Multimodality imaging of tumor xenografts and metastases in mice with combined small-animal PET, small-animal CT, and bioluminescence imaging

Affiliations

Multimodality imaging of tumor xenografts and metastases in mice with combined small-animal PET, small-animal CT, and bioluminescence imaging

Christophe M Deroose et al. J Nucl Med. 2007 Feb.

Abstract

Recent developments have established molecular imaging of mouse models with small-animal PET and bioluminescence imaging (BLI) as an important tool in cancer research. One of the disadvantages of these imaging modalities is the lack of anatomic information. We combined small-animal PET and BLI technology with small-animal CT to obtain fusion images with both molecular and anatomic information.

Methods: We used small-animal PET/CT and BLI to detect xenografts of different cell lines and metastases of a melanoma cell line (A375M-3F) that had been transduced with a lentiviral vector containing a trimodality imaging reporter gene encoding a fusion protein with Renilla luciferase, monomeric red fluorescent protein, and a mutant herpes simplex virus type 1 thymidine kinase.

Results: Validation studies in mouse xenograft models showed a good coregistration of images from both PET and CT. Melanoma metastases were detected by 18F-FDG PET, 9-[4-(18)F-fluoro-3-(hydroxymethyl)butyl]guanine (18F-FHBG) PET, CT, and BLI and confirmed by ex vivo assays of Renilla luciferase and mutant thymidine kinase expression. 18F-FHBG PET/CT allowed detection and localization of lesions that were not seen on CT because of poor contrast resolution and were not seen on 18F-FDG PET because of higher background uptake relative to 18F-FHBG.

Conclusion: The combination of 18F-FHBG PET, small-animal CT, and BLI allows a sensitive and improved quantification of tumor burden in mice. This technique is potentially useful for the study of the biologic determinants of metastasis and for the evaluation of novel cancer treatments.


Figures

FIGURE 1
FIGURE 1
Validation of CT measurements. (A) Nude mouse in imaging position on polystyrene bed. Two fiducial markers are shown before fixation to bed; positions of other markers are marked by asterisks. Scale bar is 1 cm wide. (B) Correlation between tumor volume measured on CT images and caliper-measured tumor volume. Correlation is strong (r2 = 0.92; P < 0.0001), close to identity line (slope = 1.08).
FIGURE 2
FIGURE 2
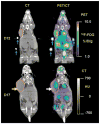
Evolution of xenograft growth at days 12 and 17 after inoculation of 0.5 × 10⁶ C6 cells in nude mouse as seen on CT and on 18F-FDG PET/CT fusion images. Tumor ROIs are outlined in orange. White arrows indicate necrotic area at periphery of tumor, visible on 18F-FDG PET image but not discriminable from viable tumor on CT image alone. Fiducial markers are indicated by blue arrows.
FIGURE 3
FIGURE 3
Detection of pulmonary metastasis with 18F-FDG PET/CT. Transverse (A) and coronal (B) sections of coregistered 18F-FDG PET and CT images of SCID mouse 45 d after tail-vein injection of 0.7 × 10⁶ A375M-Fluc melanoma cells. White arrows indicate hypermetabolic area seen on 18F-FDG PET image. Yellow arrows show water-density nodule in dorsal apex of right lung in CT image. PET/CT fusion image confirms registration of hypermetabolic image on anatomic reference (red arrow). Physiologic tracer uptake in heart (h), kidneys (k), and bladder (b) is marked.
FIGURE 4
FIGURE 4
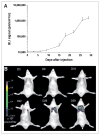
Monitoring of metastasis with BLI. (A) Growth of A375M-3F metastasis after intraventricular injection in nude mice as documented by BLI. Evolution of maximum pixel at site of metastasis over 1 mo is shown (n = 6, error bar represents SD). (B) Growth of A375M-3F pulmonary metastasis in 1 mouse.
FIGURE 5
FIGURE 5
Evolution of metastasis with 18F-FHBG PET/CT. Transverse (A) and coronal (B) sections of coregistered 18F-FHBG PET/CT images of nude mouse that received injection of A375M-3F in left ventricle. Left (yellow arrows) and right (red arrows) basal fields of lung show increase in tracer uptake from 1.8 to 2.5 %ID/g (39% increase) and from 1.4 to 2.1 %ID/g (50% increase), respectively, from week 4 to week 5, indicating progressive growth of pulmonary metastasis. Blue arrows indicate fiducial markers. Physiologic tracer uptake in intestines (i), right kidney (k), and bladder (b) is marked.
FIGURE 6
FIGURE 6
Additional value of CT in 18F-FHBG PET images of metastasis. (A) Thirty-five days after intraventricular injection of 1.5 × 10⁶ A375M-3F melanoma cells in nude mouse, 18F-FHBG PET/CT allows precise anatomic localization of metastasis in interscapular fat (a), right eye (b), right humeral head (c), and left mandibula (d) as shown by green arrows. Lack of anatomic landmarks on PET alone is illustrated by white arrows. (B) BLI shows same lesions as seen on 18F-FHBG PET/CT but does not provide information on depth of lesion. (C) Ex vivo thymidine kinase and luciferase assays of lesions (+) and contralateral controls (−) validate imaging observations.
FIGURE 7
FIGURE 7
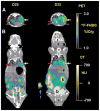
Comparison of 18F-FDG and 18F-FHBG for detection of A375M-3F metastasis. (A) Uptake of 18F-FDG and 18F-FHBG in metastatic lesions of A375M-3F in 4 mice (6 lesions) that were scanned at days 33 and 31 after injection, respectively (*P < 0.01). (B) 18F-FDG and 18F-FHBG PET scans of nude mouse on days 30 and 28 after injection of 1.5 × 10⁶ A375M-3F cells in left cardiac ventricle. Red crosshairs show metastatic lesion in right mandibula. 18F-FDG uptake is higher than 18F-FHBG uptake, but latter is specific to metastatic cells whereas 18F-FDG uptake is also prominent in heart, brain, and muscles (labeled h, b, and m, respectively). Blue arrows indicate fiducial markers. (C) Tumor-to-background contrast for muscle (T/M), liver (T/L), heart (T/H), brown fat (T/BF), and intestine (T/I) for 18F-FHBG (n = 6; 10 lesions) and 18F-FDG (n = 4; 6 lesions) in metastatic lesions of A375M-3F (mean ± SEM). Contrast is significantly higher for 18F-FHBG than for 18F-FDG (**P < 0.001), except for intestine, where it is significantly lower (#P < 0.0001).

References

    1. Gambhir SS. Molecular imaging of cancer with positron emission tomography. Nat Rev Cancer. 2002;2:683–693. - PubMed
    1. Chambers AF, Groom AC, MacDonald IC. Dissemination and growth of cancer cells in metastatic sites. Nat Rev Cancer. 2002;2:563–572. - PubMed
    1. Yu Y, Annala AJ, Barrio JR, et al. Quantification of target gene expression by imaging reporter gene expression in living animals. Nat Med. 2000;6:933–937. - PubMed
    1. Bhaumik S, Gambhir SS. Optical imaging of Renilla luciferase reporter gene expression in living mice. Proc Natl Acad Sci U S A. 2002;99:377–382. - PMC - PubMed
    1. Le LQ, Kabarowski JH, Wong S, Nguyen K, Gambhir SS, Witte ON. Positron emission tomography imaging analysis of G2A as a negative modifier of lymphoid leukemogenesis initiated by the BCR-ABL oncogene. Cancer Cell. 2002;1:381–391. - PubMed

Publication types

MeSH terms

LinkOut - more resources