Comparative Study
. 2007 Feb 21;26(4):944-54.
doi: 10.1038/sj.emboj.7601550. Epub 2007 Feb 1.

Identification of novel functional TBP-binding sites and general factor repertoires

Affiliations
Comparative Study

Identification of novel functional TBP-binding sites and general factor repertoires

Sergey Denissov et al. EMBO J. .

Abstract

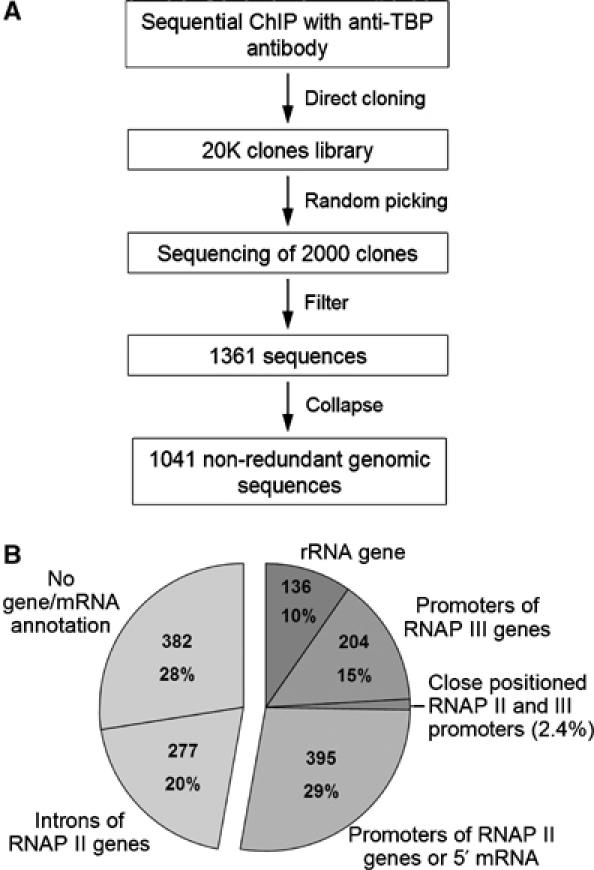
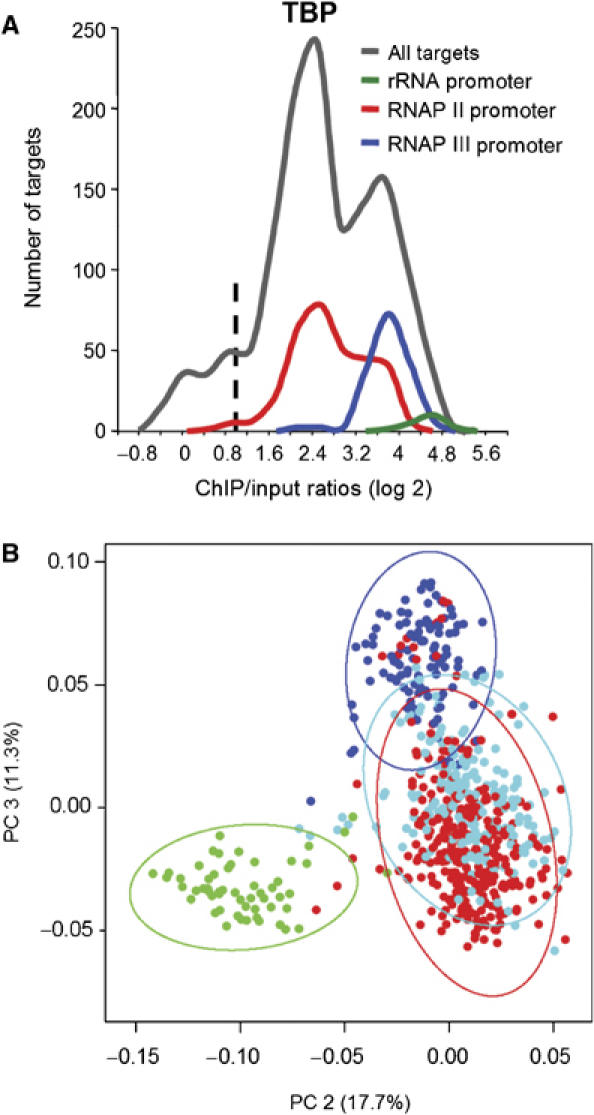
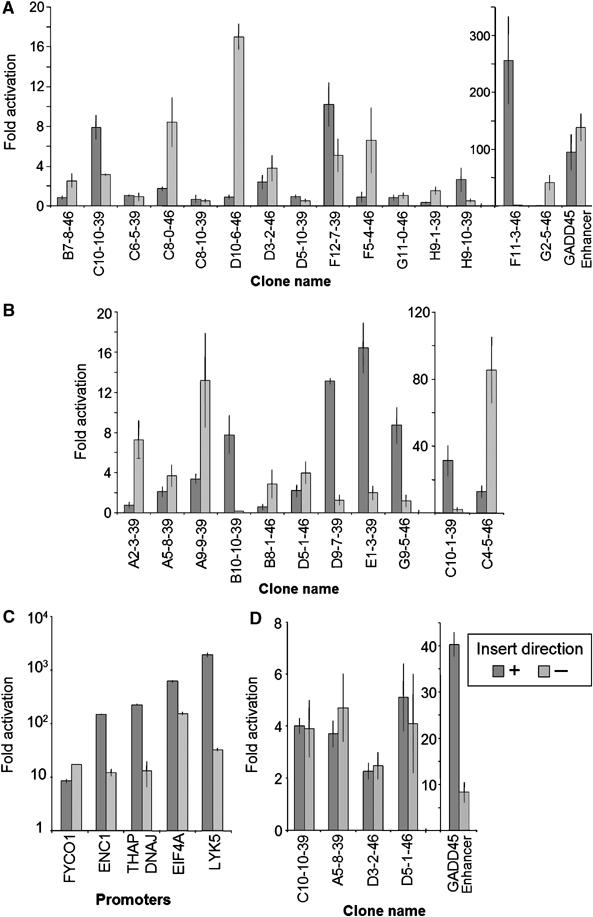
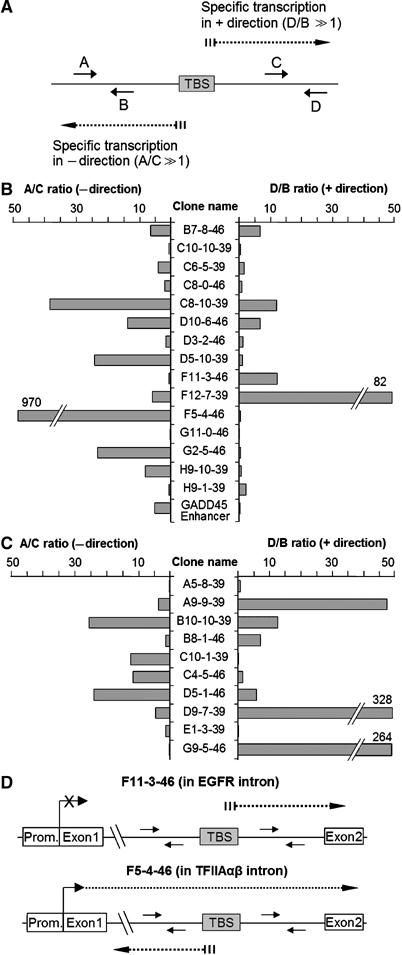
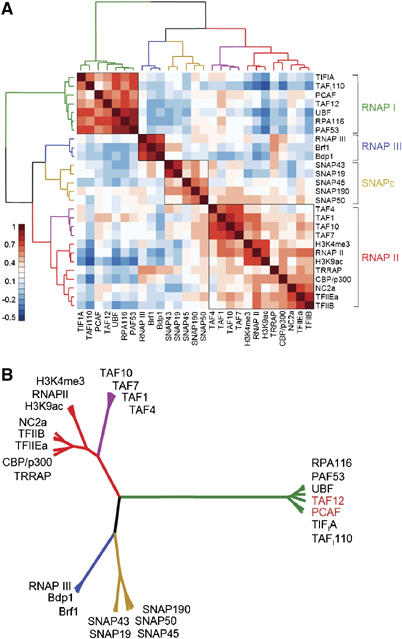
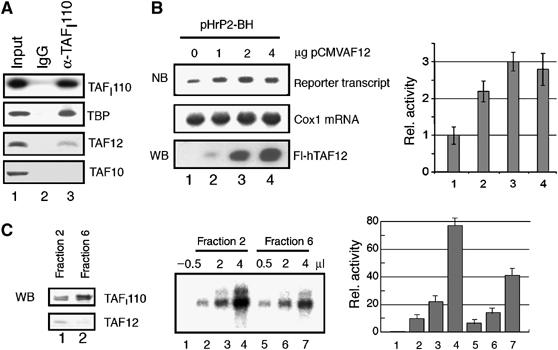
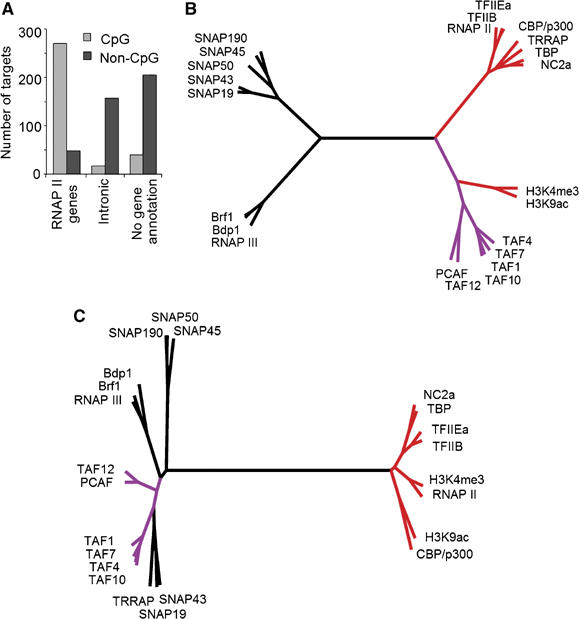
Our current knowledge of the general factor requirement in transcription by the three mammalian RNA polymerases is based on a small number of model promoters. Here, we present a comprehensive chromatin immunoprecipitation (ChIP)-on-chip analysis for 28 transcription factors on a large set of known and novel TATA-binding protein (TBP)-binding sites experimentally identified via ChIP cloning. A large fraction of identified TBP-binding sites is located in introns or lacks a gene/mRNA annotation and is found to direct transcription. Integrated analysis of the ChIP-on-chip data and functional studies revealed that TAF12 hitherto regarded as RNA polymerase II (RNAP II)-specific was found to be also involved in RNAP I transcription. Distinct profiles for general transcription factors and TAF-containing complexes were uncovered for RNAP II promoters located in CpG and non-CpG islands suggesting distinct transcription initiation pathways. Our study broadens the spectrum of general transcription factor function and uncovers a plethora of novel, functional TBP-binding sites in the human genome.


Figures

Figure 1
Figure 1
Construction and annotation of the TBP-binding site library. (A) Outline of the strategy for ChIP-cloning and filtering of sequences. ‘Filter': short sequences (<40 bp), highly repetitive sequences and those with less than 90% identity to the genome were eliminated. ‘Collapse': 497 overlapping sequences were collapsed into 177 contigs. (B) Pie diagram of annotation. Transcription-linked features were obtained from UCSC genome browser (HG16) using a 1 kb window centered at the cloned DNA sequences. Annotation of RNAP II genes was based on SWISS-PROT, TrEMBL, RefSeq and mRNA GenBank databases. Identity to rRNA genes was obtained by NCBI BLAST alignment. The number of clones in different categories was determined using the non-collapsed set of 1361 clones.
Figure 2
Figure 2
Analysis of ChIP-on-chip data for different classes of promoters. (A) Frequency histograms of TBP ChIP/input ratios (non-collapsed set). Dashed line indicates two-fold threshold. Promoters of RNAP I, II and III genes are colored in green, red and blue, respectively. Normalization controls correspond to ‘0' value on the histograms. (B) Projection of the ChIP-on-chip data set into the space of the second and third PCs. Intronic targets and those without gene/mRNA annotation are highlighted in light blue. The spaces containing 95% of targets are shown as ovals of the RNAP I, II and III targets. The fraction of variance comprised in individual PCs is indicated in brackets.
Figure 3
Figure 3
Functional analysis of novel TBP-binding sites. Genomic DNA fragments containing novel TBP-binding sites were cloned in both directions in front of promoter-less (A–C) or SV-40 promoter containing (D) reporter-gene plasmid vectors and transfected into U2OS cells; ratios of transcription activity of the reporter gene over empty vector are shown. (A) Novel TBP-binding sites located in introns of RNAP II genes. The ‘+' and ‘–' refer to the direction of transcription of the gene (sense and antisense, respectively). (B) Novel TBP-binding sites lacking gene/mRNA annotation. The ‘+' and ‘–' refer to the direction of the sequence (UCSC genome browser definition) with respect to the reporter gene. (C) Promoters of RNAP II-transcribed genes. (D) Enhancer assay: analysis of the targets in a reporter vector with SV-40 promoter. The ‘+' and ‘–' refer to the direction of the sequence (UCSC genome browser definition) with respect to the reporter gene.
Figure 4
Figure 4
Analysis of strand-specific transcripts at novel TBP-binding sites. (A) Schematic presentation of novel TBP-binding site and location of sts-RT qPCR probes. Dotted lines indicate putative transcripts initiated at the TBP-binding site. The probes named A and C are complementary to transcripts in the ‘–' direction, and probes B and D to transcripts in the ‘+' direction. The A/C and D/B ratios between RNA levels were taken to assess transcription specifically started within the novel TBP-binding sites in ‘–' and ‘+' directions, respectively. (B) The ratios A/C (left part) and D/B (right part) for TBP-binding sites in introns. Transcriptional directions indicated with ‘+' and ‘–' refer to sense and antisense direction. (C) Same as (B) measured for the TBP-binding sites loci lacking a gene annotation. The directions of transcription indicated with ‘+' and ‘–' refer to UCSC genome browser definition. (D) Schematic presentation of transcripts from the EGFR and TFIIAαβ genes.
Figure 5
Figure 5
Correlation analyses of ChIP-on-chip data sets. Pearson correlation values were calculated on entire ChIP-on-chip data set (25 antibodies against general transcription factors and two active histone marks) and structured by hierarchical clustering (Ward's). The resulting dendrogram is represented as a cluster (A) and a rooted tree (B). The latter is combined with color-visualized correlation values as depicted. The branches corresponding to the different clusters are color-coded. TBP was excluded from the analysis.
Figure 6
Figure 6
TAF12 associates with SL1 and stimulates rDNA transcription. (A) TAF12 is associated with SL1. HeLa nuclear extracts were fractionated by chromatography on phosphocellulose and SP resins, and SL1 was immunoprecipitated using anti-TAFI110 antibodies (lane 3) or rabbit IgG (lane 2) as a control. The immunoprecipitates were analyzed on Western blots for TBP, TAF12 and TAF10 as indicated. The input (lane 1) contains 50% of the material used for the IP. To monitor the efficiency of TAFI110 precipitation, 10% of the input fraction and 10% of the IP were separated by SDS–PAGE and probed with anti-TAFI110 antibodies (top panel). (B) U2OS cells were cotransfected with 2 μg of the rDNA reporter plasmid pHrP2-BH and increasing amounts of pCMV-FLAG-hTAF12 (indicated on top) in a total amount of 8 μg. Reporter transcripts and cytochrome oxidase 1 (cox 1) mRNA were detected using appropriate 32P-labeled riboprobes and quantified (NB). The expression of Flag-TAF12 was verified on Western blots with anti-FLAG antibodies (WB). The bar diagram represents the relative level of reporter transcripts from three independent experiments. (C) TAF12-containing SL1 fractions stimulate RNAP I transcription in vitro. TAF12 copurifies with transcriptionally active SL1 (left panel). HeLa nuclear extracts were chromatographed on phosphocellulose and S-Sepharose. Individual S-Sepharose fractions (20 μl of fractions 2 and 6, respectively) were probed for the presence of TAFI110 and TAF12 on immunoblots. RNAP I transcription was assayed in a reconstituted system. The reactions were supplemented with SL1 fractions containing detectable amounts of TAF12 (fraction 2) or fractions with trace amounts of TAF12 (fraction 6). In lane 1, no SL1 fraction was added. The bar diagram represents the relative level of transcription from three different experiments.
Figure 7
Figure 7
Distinct correlation profiles for CpG and non-CpG island RNAP II targets. (A) Distribution of CpG and non-CpG island targets in the different annotation groups. The CpG islands database was obtained from the UCSC genome browser. (B, C) Rooted trees represent Ward's hierarchical clustering of Pearson correlation values calculated on CpG (B) and non-CpG (C) targets. The branches of TAFs and other general transcription factors are colored in purple and red, respectively.

References

    1. Antequera F, Bird A (1994) Predicting the total number of human genes. Nat Genet 8: 114. - PubMed
    1. Basehoar AD, Zanton SJ, Pugh BF (2004) Identification and distinct regulation of yeast TATA box-containing genes. Cell 116: 699–709 - PubMed
    1. Berger SL (2002) Histone modifications in transcriptional regulation. Curr Opin Genet Dev 12: 142–148 - PubMed
    1. Bernstein BE, Kamal M, Lindblad-Toh K, Bekiranov S, Bailey DK, Huebert DJ, McMahon S, Karlsson EK, Kulbokas EJ III, Gingeras TR, Schreiber SL, Lander ES (2005) Genomic maps and comparative analysis of histone modifications in human and mouse. Cell 120: 169–181 - PubMed
    1. Bertone P, Stolc V, Royce TE, Rozowsky JS, Urban AE, Zhu X, Rinn JL, Tongprasit W, Samanta M, Weissman S, Gerstein M, Snyder M (2004) Global identification of human transcribed sequences with genome tiling arrays. Science 306: 2242–2246 - PubMed

Publication types

MeSH terms