Comparative Study
. 2007 Mar 1;79(5):2137-49.
doi: 10.1021/ac062160k. Epub 2007 Feb 1.

Fluorescence lifetime standards for time and frequency domain fluorescence spectroscopy

Affiliations
Comparative Study

Fluorescence lifetime standards for time and frequency domain fluorescence spectroscopy

Noël Boens et al. Anal Chem. .

Abstract

A series of fluorophores with single-exponential fluorescence decays in liquid solution at 20 degrees C were measured independently by nine laboratories using single-photon timing and multifrequency phase and modulation fluorometry instruments with lasers as excitation source. The dyes that can serve as fluorescence lifetime standards for time-domain and frequency-domain measurements are all commercially available, are photostable under the conditions of the measurements, and are soluble in solvents of spectroscopic quality (methanol, cyclohexane, water). These lifetime standards are anthracene, 9-cyanoanthracene, 9,10-diphenylanthracene, N-methylcarbazole, coumarin 153, erythrosin B, N-acetyl-l-tryptophanamide, 1,4-bis(5-phenyloxazol-2-yl)benzene, 2,5-diphenyloxazole, rhodamine B, rubrene, N-(3-sulfopropyl)acridinium, and 1,4-diphenylbenzene. At 20 degrees C, the fluorescence lifetimes vary from 89 ps to 31.2 ns, depending on fluorescent dye and solvent, which is a useful range for modern pico- and nanosecond time-domain or mega- to gigahertz frequency-domain instrumentation. The decay times are independent of the excitation and emission wavelengths. Dependent on the structure of the dye and the solvent, the excitation wavelengths used range from 284 to 575 nm, the emission from 330 to 630 nm. These lifetime standards may be used to either calibrate or test the resolution of time- and frequency-domain instrumentation or as reference compounds to eliminate the color effect in photomultiplier tubes. Statistical analyses by means of two-sample charts indicate that there is no laboratory bias in the lifetime determinations. Moreover, statistical tests show that there is an excellent correlation between the lifetimes estimated by the time-domain and frequency-domain fluorometries. Comprehensive tables compiling the results for 20 (fluorescence lifetime standard/solvent) combinations are given.


Figures
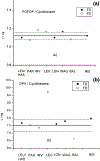
Figure 1.
Figure 1.
(a) Lifetimes τ of POPOP in cyclohexane at 20 °C estimated by the various laboratories. The boldface solid line indicates the average value τ¯; the dashed lines represent τ¯ ± one sample standard deviation s (standard uncertainty u). (b) Corresponding figure for DPA in cyclohexane. The point determined by LEU (FD) is an outlier and was not taken into account in the calculation of the average lifetime τ¯ and its standard deviation s.
Figure 2.
Figure 2.
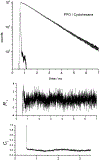
Data obtained by the single-photon timing technique using a mode-locked Ti:sapphire laser pumped by the second harmonic (532 nm) of a YAG laser. The output of the Ti:sapphire laser was frequency tripled to obtain the UV excitation wavelength. Experimental fluorescence decay trace of PPO in degassed cyclohexane at 20 °C (excitation wavelength λex = 290 nm, observation wavelength λem = 380 nm, number of channels used in the fitting 3620, channel width 1.85 ps). The instrument response function u(t) measured with a Ludox scattering solution in water and the best monoexponential fit to the experimental decay data are also displayed. The plot of the weighted residuals Ri versus time and the autocorrelation function Cj are given in the lower panels. Results: τ = 1.357 ± 0.002 ns, χν2 = 1.072, ν2 = 3.059. The quoted error represents one standard deviation (standard uncertainty).
Figure 3.
Figure 3.
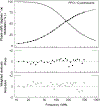
Experimental phase shift and modulation data of PPO in degassed cyclohexane at 20 °C (excitation wavelength λex = 300 nm, observation wavelength λem = 360 nm) measured versus a Ludox scattering solution in water using a mode-locked laser as excitation source. The full lines show the best monoexponential fit to the experimental data. The lower panels show the deviations in phase and modulation from the single-exponential fit. Number of frequencies ω: 28, from 12 to 500 MHz. Results: τ = 1.34 ns, χν2 = 1.2.
Figure 4.
Figure 4.
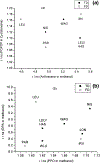
Two-sample method for the detection of laboratory bias. (a) Lifetime data of anthracene in methanol (x-ordinate) versus those of POPOP in cyclohexane (y-ordinate). Best linear least-squares fit to the data: y = (1.1 ± 0.3) + (0.009 ± 0.063) x (correlation coefficient r = 0.069). (b) Lifetime data of PPO in methanol (x-ordinate) versus those of DPA in methanol (y-ordinate). Regression equation: y = (5.6 ± 7.2) + (1.9 ± 4.3) x (correlation coefficient r = 0.178). The quoted errors represent one standard error for the intercept and the slope.
Figure 5.
Figure 5.
Linear least-squares fitting when both variables have uncertainties for assessing the comparability of the pulse (TD) and phase-modulation (FD) fluorometries. The mean τ¯FD-values (y) obtained for the samples of Table 2 are plotted against the corresponding mean τ¯TD-values (x). Regression equation: y = (−0.001 ± 0.005) + (1.02 ± 0.01) x (correlation coefficient r = 0.978). Number of observations n = 18. The quoted errors represent one standard error for the intercept and the slope. The standard deviations (standard uncertainties)64 on τ¯FD and τ¯TD are also displayed (when they are larger than the used symbols).

References

    1. Demas JN Excited-State Lifetime Measurements; Academic Press: New York, 1983.
    1. Cundall RB, Dale RE, Eds. Time-resolved Fluorescence Spectroscopy in Biochemistry and Biology; Plenum Press: New York, 1983.
    1. O’Connor DV; Phillips D Time-correlated Single Photon Counting; Academic Press: London, 1984.
    1. van Hoek A; Visser AJWG Anal. Instrum 1985, 14, 359–378.
    1. Jameson DM; Gratton E; Hall RD Appl. Spectrosc. Rev 1984, 20, 55–106.

Publication types

MeSH terms