

The long-term natural history of geographic atrophy from age-related macular degeneration: enlargement of atrophy and implications for interventional clinical trials
- PMID: 17270676
- PMCID: PMC2562326
- DOI: 10.1016/j.ophtha.2006.09.016
The long-term natural history of geographic atrophy from age-related macular degeneration: enlargement of atrophy and implications for interventional clinical trials
Abstract
Purpose: To report the enlargement rate of geographic atrophy (GA) over time, its relationship to size of atrophy at baseline and to prior enlargement rate, and the implications for designing future treatment trials for GA.
Design: Prospective natural history study of GA resulting from age-related macular degeneration.
Participants: Two hundred twelve eyes of 131 patients were included in the analysis.
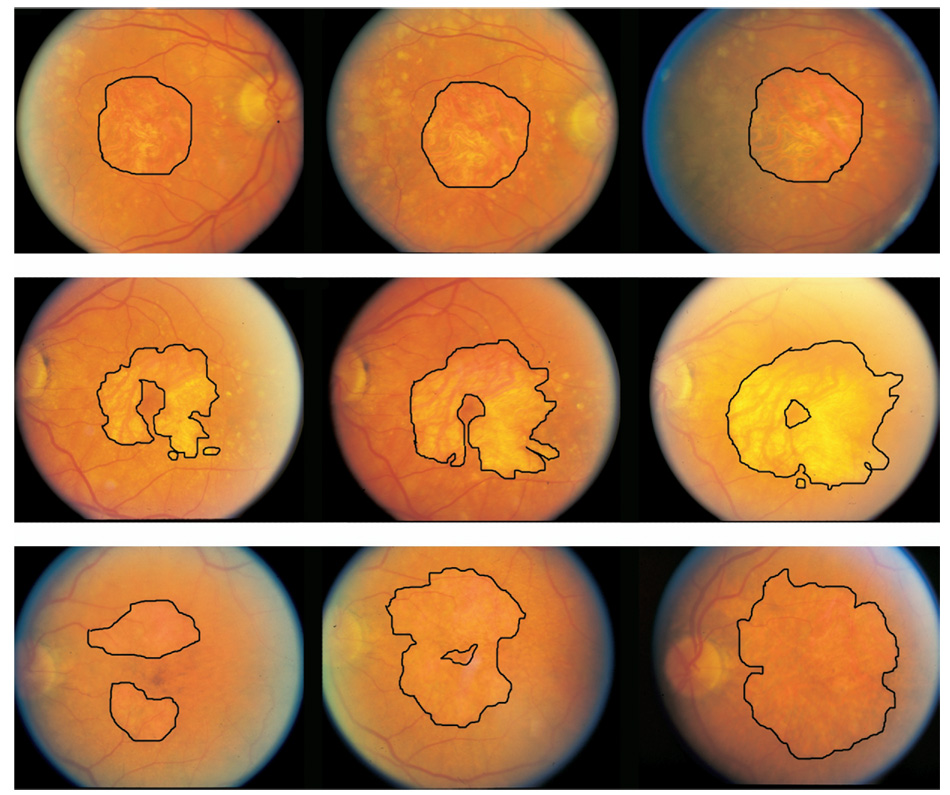
Methods: Annual follow-up included stereo color fundus photographs. The areas of GA were identified and measured, and the rate of enlargement of the atrophy was assessed. Sample sizes for clinical trials using systemic treatment and uniocular treatment were determined.
Main outcome measure: Rate of enlargement of the atrophy.
Results: The median overall enlargement rate was 2.1 mm2/year (mean, 2.6 mm2/year). Eyes with larger areas of atrophy at baseline tended to have larger enlargement rates, but knowledge of prior rates of enlargement was the most significant factor in predicting subsequent enlargement rates. There was high concordance between the enlargement rates in the 2 eyes of patients with bilateral GA (correlation coefficient, 0.76). To detect a 25% reduction in enlargement rate for a systemic treatment (alpha, 0.05; power, 0.80; losses to follow-up, 15%), 153 patients each in a control and treatment group would be required for a trial with a 2-year follow-up period for each patient. For a uniocular treatment, 38 patients with bilateral GA would be required, with the untreated eye serving as a control for the treated eye.
Conclusions: Treatment trials for GA with an outcome variable of change in enlargement rate are feasible.
Conflict of interest statement
No conflicting relationship exists for any of the authors.
Figures


References
-
- Klein R, Klein BE, Franke T. The relationship of cardiovascular disease and its risk factors to age-related maculopathy: the Beaver Dam Eye Study. Ophthalmology. 1993;100:406–414. - PubMed
-
- Vingerling JR, Dielemans I, Hofman A, et al. The prevalence of age-related maculopathy in the Rotterdam Study. Ophthalmology. 1995;102:205–210. - PubMed
-
- Hirvela H, Luukinen H, Laara E, et al. Risk factors of age-related maculopathy in a population 70 years of age or older. Ophthalmology. 1996;103:871–877. - PubMed
-
- Potter JW, Thallemer JM. Geographic atrophy of the retinal pigment epithelium: diagnosis and vision rehabilitation. J Am Optom Assoc. 1981;52:503–508. - PubMed
-
- Sunness JS, Gonzalez-Baron J, Applegate CA, et al. Enlargement of atrophy and visual acuity loss in the geographic. Ophthalmology. 1999;106:1768–1779. - PubMed
Publication types
MeSH terms
Grants and funding
LinkOut - more resources
Full Text Sources
Other Literature Sources
Medical
