. 2007 Mar;80(3):441-56.
doi: 10.1086/512485. Epub 2007 Jan 30.

Evidence of positive selection on a class I ADH locus

Affiliations

Evidence of positive selection on a class I ADH locus

Yi Han et al. Am J Hum Genet. 2007 Mar.

Abstract

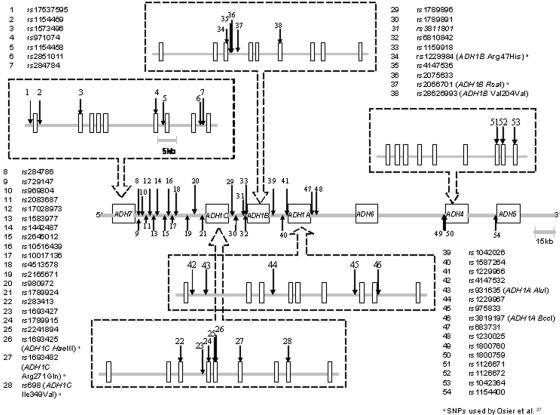
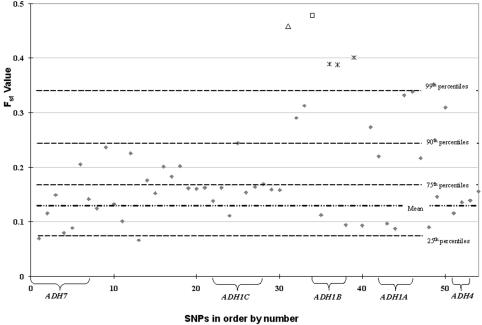
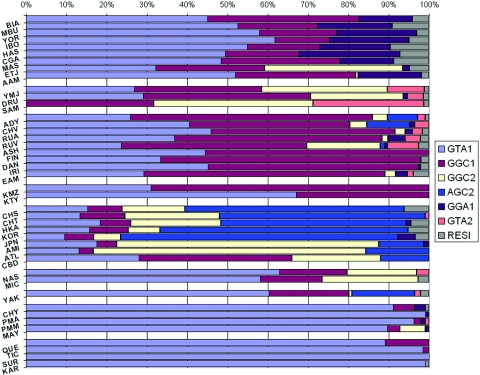
The alcohol dehydrogenase (ADH) family of enzymes catalyzes the reversible oxidation of alcohol to acetaldehyde. Seven ADH genes exist in a segment of ~370 kb on 4q21. Products of the three class I ADH genes that share 95% sequence identity are believed to play the major role in the first step of ethanol metabolism. Because the common belief that selection has operated at the ADH1B*47His allele in East Asian populations lacks direct biological or statistical evidence, we used genomic data to test the hypothesis. Data consisted of 54 single-nucleotide polymorphisms (SNPs) across the ADH clusters in a global sampling of 42 populations. Both the F(st) statistic and the long-range haplotype (LRH) test provided positive evidence of selection in several East Asian populations. The ADH1B Arg47His functional polymorphism has the highest F(st) of the 54 SNPs in the ADH cluster, and it is significantly above the mean F(st) of 382 presumably neutral sites tested on the same 42 population samples. The LRH test that uses cores including that site and extending on both sides also gives significant evidence of positive selection in some East Asian populations for a specific haplotype carrying the ADH1B*47His allele. Interestingly, this haplotype is present at a high frequency in only some East Asian populations, whereas the specific allele also exists in other East Asian populations and in the Near East and Europe but does not show evidence of selection with use of the LRH test. Although the ADH1B*47His allele conveys a well-confirmed protection against alcoholism, that modern phenotypic manifestation does not easily translate into a positive selective force, and the nature of that selective force, in the past and/or currently, remains speculative.


Figures

Figure  1.
Figure 1.
Map of the 54 SNPs that cover the ADH7, ADH1C, ADH1B, ADH1A, and ADH4 genes on chromosome 4. SNPs within each locus are shown in an enlarged box with segmented border, whereas SNPs in intergenic regions are listed beside the chromosome segment. The different scales of distance measurement are shown. SNPs are numbered as mentioned in the text.
Figure  2.
Figure 2.
Flow charts illustrating the demographic model used for the simulations. Top, Population constant at size 10,000 until it experienced a brief bottleneck 3,000 generations ago, which dropped the population size to 2,000. Then the population was constant at size 2,000 until 500 generations ago (on the basis of the rough estimates that the Neolithic period started 9,000–10,000 years ago in East Asia and that the generation length is 20 years, the upper bound of 500 generations was used in this simulation), when it expanded suddenly by a factor of 50. The Ne (effective population size) for the entire period (3,000 generations) for this model is ∼2,400. Middle, Population constant at size 10,000 until it experienced a brief bottleneck 3,000 generations ago, which dropped the population size to 2,000. Then the population was constant at size 2,000 until 500 generations ago (the same estimation as for the first model), when it expanded exponentially to the current size of 100,000. The Ne for the entire period (3,000 generations) for this model is ∼2,300. Bottom, Model of the unlikely demographic of a population with a constant size of 10,000.
Figure  3.
Figure 3.
The pairwise comparison of allele frequencies in four ADH subregions among all 42 populations. The color scheme is based on the correlation of allele frequencies between each pair of populations, with bright red representing complete correlation (r2=1) and dark blue representing no correlation (r2=0). Both horizontal and vertical axes represent the same 42 populations in the same order as in figures 5 and 10. Generally speaking, the correlation level among populations within the same geographic location tends to be strong. Occasionally, the strong correlation can extend across geographic regions, such as in the intergenic region ADH7–class I ADH (strong correlation extends through Africa, southwestern Asia, and Europe) and downstream of class I ADH (strong correlation extends through southwestern Asia, Europe, and East Asia). Class I ADH, which is of particular interest to our positive-selection study, shows an allele-frequency correlation pattern that makes East Asian populations distinct from those of the rest of the world. Populations are ordered from Africa (1–9), southwestern Asia (10–12), Europe (13–21), northwestern Asia (22–23), East Asia (24–31), Pacific Islands (32–33), northeastern Siberia (34), North America (35–38), and South America (39–42).
Figure  4.
Figure 4.
Average Fst values of 42 populations for 54 SNPs, ordered as in table 1 (not to scale). The Mean Fst value of 382 reference sites in 42 populations is represented with a discontinuous dotted line. The 25th, 75th, 90th, and 99th percentiles based on those data are represented with dotted lines. The bracket for each ADH gene includes all SNPs within each gene. SNP 34, ADH1B Arg47His, has the highest Fst value (unblackened square); SNP 31, rs3811801, has the second highest Fst value (unblackened triangle); SNPs 36, 37, and 39, which also have an Fst value >99th percentile, are represented by an asterisk (*).
Figure  5.
Figure 5.
The haplotype pattern of SNPs 34–38 (ADH1B Arg47His, rs4147536, rs2075633, RsaI, and Val204Val) within the ADH1B gene for 42 populations. Populations are grouped by geographic region, with regions roughly in order of distance from Africa: Africa (including AAM), southwestern Asia, Europe, northwestern Asia, East Asia, Pacific, eastern Siberia, North America, and South America. Haplotype 2CG2G is prominent in East Asian populations (except CBD) but is barely seen in the rest of the world (with a few exceptions, such as NAS, MIC, etc.).
Figure  6.
Figure 6.
Haplotype-bifurcation diagrams for each core haplotype with at least 7% frequency at the ADH1B gene region for eight East Asian populations. The core haplotype 2CG2G shows unusual long-range homozygosity in all East Asia populations except CBD.
Figure  7.
Figure 7.
A, EHH and REHH plots of core haplotypes covering SNPs 34–38 in all eight East Asian populations. The EHH and REHH values are plotted against the physical distance extending both upstream and downstream of the selected core region. Only core haplotypes with frequency >9% are shown. The EHH and REHH curves based on the core haplotype of interest, 2CG2G, are colored and symbolized in different populations, whereas curves of other core haplotypes are presented in gray. JPN and KOR have the highest EHH and REHH values and the longest extension of high levels upstream of the core, whereas CBD has the lowest values and the shortest extension from the core. The low REHH values of the downstream region seem to negate the possibility of selection operating on variation in that direction, despite the corresponding high EHH levels. B, EHH and REHH plots of core haplotypes covering SNPs 34–38 in the pooled five East Asian populations (JPN, KOR, CHS, CHT, and HKA). The region upstream of the core haplotype 2CG2G shows higher EHH levels over distance (compared with the other core haplotypes) and even significantly higher REHH levels.
Figure  8.
Figure 8.
A, REHH values at the most distant marker, ∼117 kb proximal, plotted against the core haplotype frequencies for 37 populations and the pooled five East Asian populations (HKA, JPN, KOR, CHS, and CHT). The blackened diamond represents the REHH value of core haplotype 2CG2G for the pooled five East Asian populations. B, At the most distant marker, ∼117 kb proximal, REHH values of the pooled five populations and of the simulated data, plotted against the core haplotype frequency. The blackened diamond represents the REHH value of core haplotype 2CG2G for the pooled five East Asian populations, whereas the gray dots are simulated data. The 50th (squares), 75th (*), and 95th (triangles) percentile curves are drawn for visual comparison.
Figure  9.
Figure 9.
Phylogenetic network of eight major haplotypes of seven SNPs for ADH1B. The seven SNPs are rs6810842 (S1), rs1159918 (S2), ADH1B Arg47His (S3), rs4147536 (S4), rs2075633 (S5), RsaI (S6), and Val204Val (S7). All haplotypes in this figure are observed with frequency >5% and are definitely present in at least one individual in our samples. The pie charts represent the haplotypes, and the segments of the pie charts show the proportions of the haplotypes that occurred in each geographic region. This network is started from the ancestral haplotype GA1CA1G. Each arrow represents a single base mutation for the site indicated beside the arrow. The East Asian–specific haplotype GC2GC2G is included in the network; this haplotype was likely generated by recombination between haplotype GC2CA1G, occurring predominantly in southwestern Asia, and haplotype GC1CG2G, occurring much more broadly.
Figure  10.
Figure 10.
Haplotype pattern of SNPs 31–34 (rs3811801, rs6810842, rs1159918, and ADH1B Arg47His) for 42 populations. Abbreviations are shown in table 1.
Figure  11.
Figure 11.
EHH (left) and REHH (right) plots of core haplotypes covering SNPs 31–34 in all eight East Asian populations. EHH and REHH curves based on the core haplotype of interest, AGC2, are colored and symbolized in different populations, whereas curves of other core haplotypes are presented in gray. Because of the low core-haplotype frequencies, CBD, Ami, and ATL show unexpectedly high EHH (even REHH) levels. The other five populations show similar levels of EHH values (upstream) over distance. KOR and JPN show the highest REHH values (upstream), in agreement with the observations from figure 7A.

References

Web Resources

    1. ALFRED, http://alfred.med.yale.edu/
    1. dbSNP, http://www.ncbi.nlm.nih.gov/projects/SNP/
    1. Online Mendelian Inheritance in Man (OMIM), http://www.ncbi.nlm.nih.gov/Omim/ (for alcohol dependence, ADH1B, ADH1C, ALDH2, ADH1A, ADH4, ADH5, ADH7, and ADH6)
    1. UCSC Genome Browser, http://genome.ucsc.edu/cgi-bin/hgGateway

References

    1. Ramchandani VA, Bosron WF, Li TK (2001) Research advances in ethanol metabolism. Pathol Biol (Paris) 49:676–682 - PubMed
    1. Yoshida A, Hsu LC, Yasunami M (1991) Genetics of human alcohol-metabolizing enzymes. Prog Nucleic Acid Res Mol Biol 40:255–287 - PubMed
    1. Agarwal DP, Goedde HW (1992) Pharmacogenetics of alcohol metabolism and alcoholism. Pharmacogenetics 2:48–6210.1097/00008571-199204000-00002 - DOI - PubMed
    1. Osier MV, Pakstis AJ, Goldman D, Edenberg HJ, Kidd JR, Kidd KK (2002) A proline-threonine substitution in codon 351 of ADH1C is common in Native Americans. Alcohol Clin Exp Res 26:1759–1763 - PubMed
    1. Mulligan CJ, Robin RW, Osier MV, Sambuughin N, Goldfarb LG, Kittles RA, Hesselbrock D, Goldman D, Long JC (2003) Allelic variation at alcohol metabolism genes (ADH1B, ADH1C, ALDH2) and alcohol dependence in an American Indian population. Hum Genet 113:325–33610.1007/s00439-003-0971-z - DOI - PubMed

Publication types

LinkOut - more resources