

Patterns of variation in DNA segments upstream of transcription start sites
- PMID: 17274005
- PMCID: PMC2683062
- DOI: 10.1002/humu.20463
Patterns of variation in DNA segments upstream of transcription start sites
Abstract
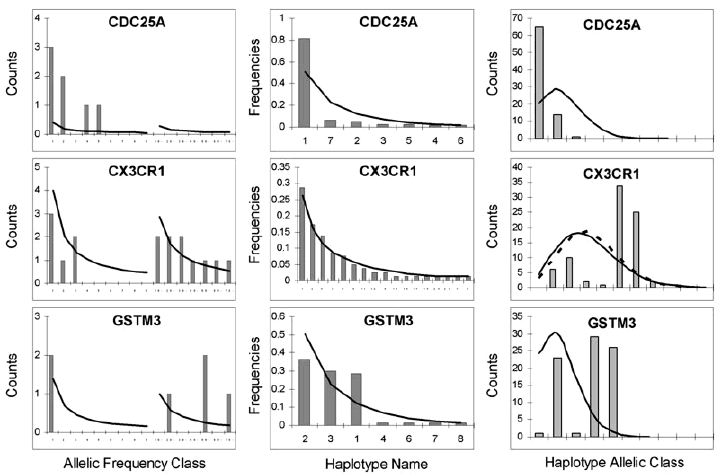
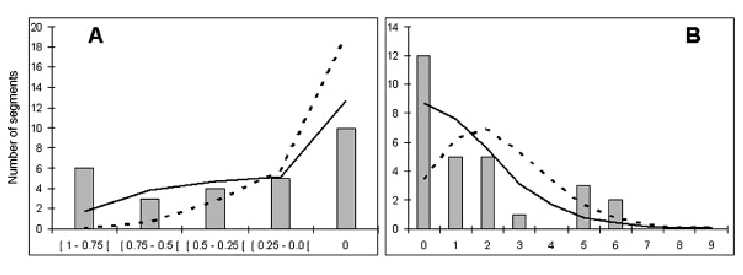
It is likely that evolutionary differences among species are driven by sequence changes in regulatory regions. Likewise, polymorphisms in the promoter regions may be responsible for interindividual differences at the level of populations. We present an unbiased survey of genetic variation in 2-kb segments upstream of the transcription start sites of 28 protein-coding genes, characterized in five population groups of different geographic origin. On average, we found 9.1 polymorphisms and 8.8 haplotypes per segment with corresponding nucleotide and haplotype diversities of 0.082% and 58%, respectively. We characterized these segments through different summary statistics, Hardy-Weinberg equilibria fixation index (Fst) estimates, and neutrality tests, as well as by analyzing the distributions of haplotype allelic classes, introduced here to assess the departure from neutrality and examined by coalescent simulations under a simple population model, assuming recombinations or different demography. Our results suggest that genetic diversity in some of these regions could have been shaped by purifying selection and driven by adaptive changes in the other, thus explaining the relatively large variance in the corresponding genetic diversity indices loci. However, some of these effects could be also due to linkage with surrounding sequences, and the neutralists' explanations cannot be ruled out given uncertainty in the underlying demographic histories and the possibility of random effects due to the small size of the studied segments.
2007 Wiley-Liss, Inc.
Figures
Similar articles
-
Haplotype allelic classes for detecting ongoing positive selection.BMC Bioinformatics. 2010 Jan 28;11:65. doi: 10.1186/1471-2105-11-65. BMC Bioinformatics. 2010. PMID: 20109229 Free PMC article.
-
Complex high-resolution linkage disequilibrium and haplotype patterns of single-nucleotide polymorphisms in 2.5 Mb of sequence on human chromosome 21.Genomics. 2001 Nov;78(1-2):64-72. doi: 10.1006/geno.2001.6646. Genomics. 2001. PMID: 11707074
-
Nucleotide variation and haplotype diversity in a 10-kb noncoding region in three continental human populations.Genetics. 2006 Sep;174(1):399-409. doi: 10.1534/genetics.106.060301. Epub 2006 Jun 18. Genetics. 2006. PMID: 16783003 Free PMC article.
-
Single Nucleotide Polymorphisms in 5' Upstream Region of Bovine TLR4 Gene Affecting Expression Profile and Transcription Factor Binding Sites.Anim Biotechnol. 2018 Apr 3;29(2):119-128. doi: 10.1080/10495398.2017.1326929. Epub 2017 Jun 8. Anim Biotechnol. 2018. PMID: 28594279
-
HLA-E regulatory and coding region variability and haplotypes in a Brazilian population sample.Mol Immunol. 2017 Nov;91:173-184. doi: 10.1016/j.molimm.2017.09.007. Epub 2017 Sep 23. Mol Immunol. 2017. PMID: 28946074 Clinical Trial.
Cited by
-
Common variants of the BRCA1 wild-type allele modify the risk of breast cancer in BRCA1 mutation carriers.Hum Mol Genet. 2011 Dec 1;20(23):4732-47. doi: 10.1093/hmg/ddr388. Epub 2011 Sep 2. Hum Mol Genet. 2011. PMID: 21890493 Free PMC article.
-
iHDSel software: The price equation and the population stability index to detect genomic patterns compatible with selective sweeps. An example with SARS-CoV-2.Biol Methods Protoc. 2024 Nov 27;9(1):bpae089. doi: 10.1093/biomethods/bpae089. eCollection 2024. Biol Methods Protoc. 2024. PMID: 39679303 Free PMC article.
-
Haplotype allelic classes for detecting ongoing positive selection.BMC Bioinformatics. 2010 Jan 28;11:65. doi: 10.1186/1471-2105-11-65. BMC Bioinformatics. 2010. PMID: 20109229 Free PMC article.
-
Fraction of informative recombinations: a heuristic approach to analyze recombination rates.Genetics. 2008 Apr;178(4):2069-79. doi: 10.1534/genetics.107.082255. Genetics. 2008. PMID: 18430934 Free PMC article.
References
-
- Bandelt HJ, Forster P, Rohl A. Median-joining networks for inferring intraspecific phylogenies. Mol Biol Evol. 1999;16:37–48. - PubMed
-
- Belanger H, Beaulieu P, Moreau C, Labuda D, Hudson TJ, Sinnett D. Functional promoter SNPs in cell cycle checkpoint genes. Hum Mol Genet. 2005;14:2641–2648. - PubMed
-
- Bourgeois S, Labuda D. Dynamic allele-specific oligonucleotide hybridization on solid support (DASO) Anal Biochem. 2004;324:309–311. - PubMed
Publication types
MeSH terms
Substances
LinkOut - more resources
Full Text Sources
Miscellaneous
