

fMRI analysis for motor paradigms using EMG-based designs: a validation study
- PMID: 17274019
- PMCID: PMC6871434
- DOI: 10.1002/hbm.20336
fMRI analysis for motor paradigms using EMG-based designs: a validation study
Abstract
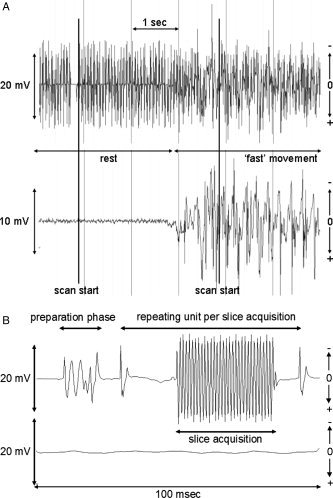
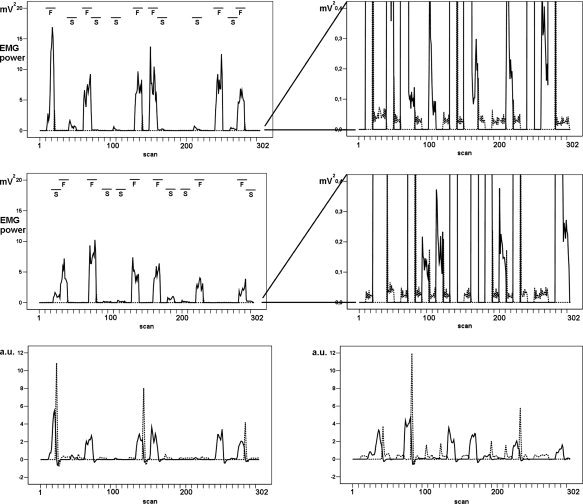
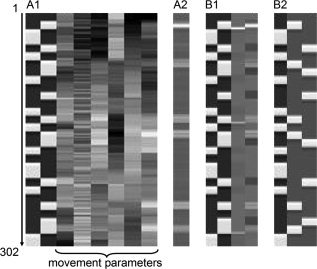
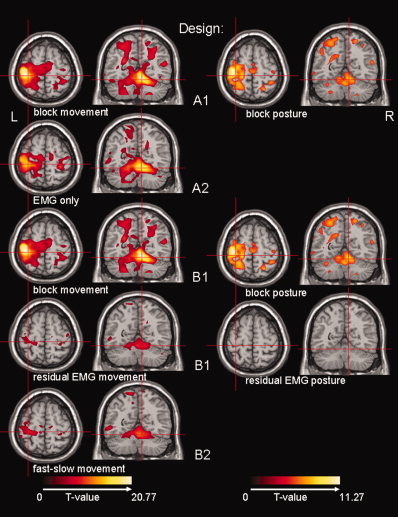
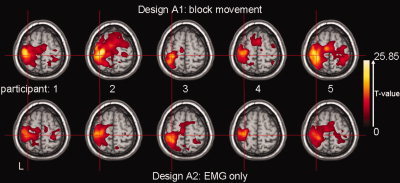
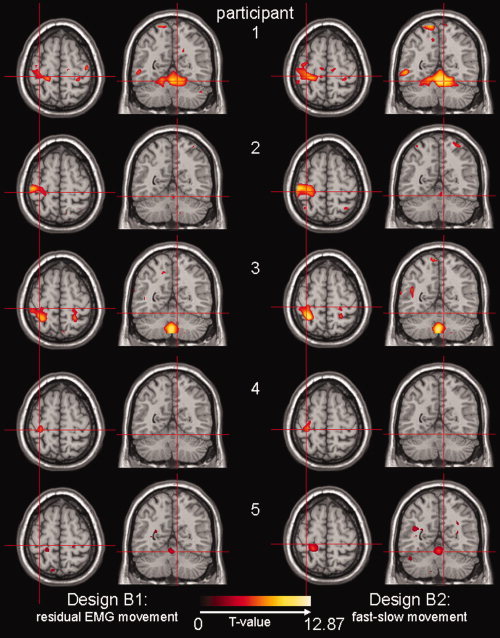
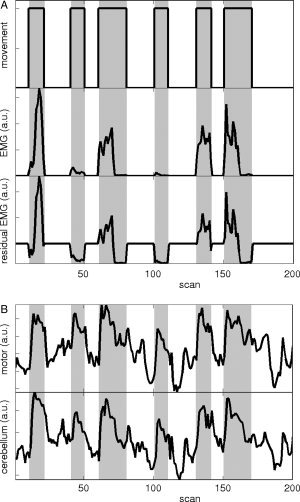
The goal of the present validation study is to show that continuous surface EMG recorded simultaneously with 3T fMRI can be used to identify local brain activity related to (1) motor tasks, and to (2) muscle activity independently of a specific motor task, i.e. spontaneous (abnormal) movements. Five healthy participants performed a motor task, consisting of posture (low EMG power), and slow (medium EMG power) and fast (high EMG power) wrist flexion-extension movements. Brain activation maps derived from a conventional block design analysis (block-only design) were compared with brain activation maps derived using EMG-based regressors: (1) using the continuous EMG power as a single regressor of interest (EMG-only design) to relate motor performance and brain activity, and (2) using EMG power variability as an additional regressor in the fMRI block design analysis to relate movement variability and brain activity (mathematically) independent of the motor task. The agreement between the identified brain areas for the block-only design and the EMG-only design was excellent for all participants. Additionally, we showed that EMG power variability correlated well with activity in brain areas known to be involved in movement modulation. These innovative EMG-fMRI analysis techniques will allow the application of novel motor paradigms. This is an important step forward in the study of both the normally functioning motor system and the pathophysiological mechanisms in movement disorders.
Copyright 2007 Wiley-Liss, Inc.
Figures
Similar articles
-
Simultaneous EMG-functional MRI recordings can directly relate hyperkinetic movements to brain activity.Hum Brain Mapp. 2008 Dec;29(12):1430-41. doi: 10.1002/hbm.20477. Hum Brain Mapp. 2008. PMID: 17979119 Free PMC article.
-
Relationship between muscle output and functional MRI-measured brain activation.Exp Brain Res. 2001 Oct;140(3):290-300. doi: 10.1007/s002210100815. Exp Brain Res. 2001. PMID: 11681304
-
Further insight into the task-dependent excitability of motor evoked potentials in first dorsal interosseous muscle in humans.Exp Brain Res. 2001 Oct;140(4):387-96. doi: 10.1007/s002210100842. Exp Brain Res. 2001. PMID: 11685391
-
Measurement of voluntary activation based on transcranial magnetic stimulation over the motor cortex.J Appl Physiol (1985). 2016 Sep 1;121(3):678-86. doi: 10.1152/japplphysiol.00293.2016. Epub 2016 Jul 14. J Appl Physiol (1985). 2016. PMID: 27418687 Review.
-
Evaluation of movement and brain activity.Clin Neurophysiol. 2021 Oct;132(10):2608-2638. doi: 10.1016/j.clinph.2021.04.023. Epub 2021 Aug 19. Clin Neurophysiol. 2021. PMID: 34488012 Free PMC article. Review.
Cited by
-
Neuroimaging essentials in essential tremor: a systematic review.Neuroimage Clin. 2014 May 9;5:217-31. doi: 10.1016/j.nicl.2014.05.003. eCollection 2014. Neuroimage Clin. 2014. PMID: 25068111 Free PMC article.
-
Is there a role for combined EMG-fMRI in exploring the pathophysiology of essential tremor and improving functional neurosurgery?PLoS One. 2012;7(10):e46234. doi: 10.1371/journal.pone.0046234. Epub 2012 Oct 1. PLoS One. 2012. PMID: 23049695 Free PMC article.
-
Accounting for movement increases sensitivity in detecting brain activity in Parkinson's disease.PLoS One. 2012;7(5):e36271. doi: 10.1371/journal.pone.0036271. Epub 2012 May 1. PLoS One. 2012. PMID: 22563486 Free PMC article.
-
Relation between muscle and brain activity during isometric contractions of the first dorsal interosseus muscle.Hum Brain Mapp. 2008 Mar;29(3):281-99. doi: 10.1002/hbm.20388. Hum Brain Mapp. 2008. PMID: 17394210 Free PMC article.
-
Development of a trunk motor paradigm for use in neuroimaging.Transl Neurosci. 2020 Jun 1;11(1):193-200. doi: 10.1515/tnsci-2020-0116. eCollection 2020. Transl Neurosci. 2020. PMID: 33335758 Free PMC article.
References
-
- Allen PJ,Josephs O,Turner R ( 2000): A method for removing imaging artifact from continuous EEG recorded during functional MRI. Neuroimage 12: 230–239. - PubMed
-
- Armitage P,Berry G ( 1994): Statistical Methods in Medical Research. Oxford: Blackwell Science.
-
- Basmajian JV,de Luca CJ ( 1985): Description and Analysis of the EMG Signal In: Muscles Alive: Their Functions Revealed by Electromyography. Baltimore, MD: Williams and Wilkins; pp 65–100.
-
- Dai TH,Liu JZ,Sahgal V,Brown RW,Yue GH ( 2001): Relationship between muscle output and functional MRI‐measured brain activation. Exp Brain Res 140: 290–300. - PubMed
-
- Feige B,Scheffler K,Esposito F,Di Salle F,Hennig J,Seifritz E ( 2005): Cortical and subcortical correlates of electroencephalographic alpha rhythm modulation.J Neurophysiol 93: 2864–2872. - PubMed
Publication types
MeSH terms
LinkOut - more resources
Full Text Sources
Medical
