

Robustness can evolve gradually in complex regulatory gene networks with varying topology
- PMID: 17274682
- PMCID: PMC1794322
- DOI: 10.1371/journal.pcbi.0030015
Robustness can evolve gradually in complex regulatory gene networks with varying topology
Abstract
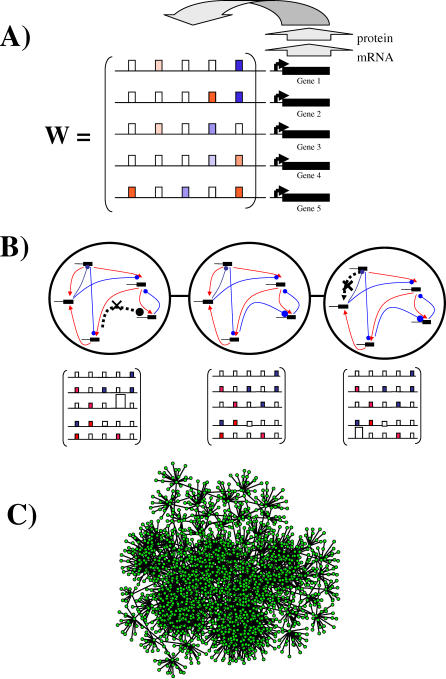
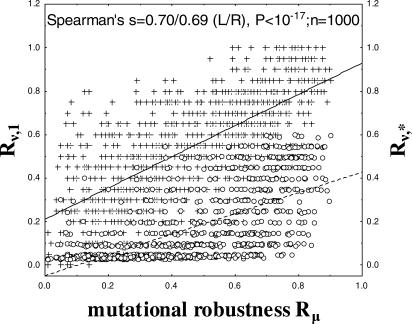
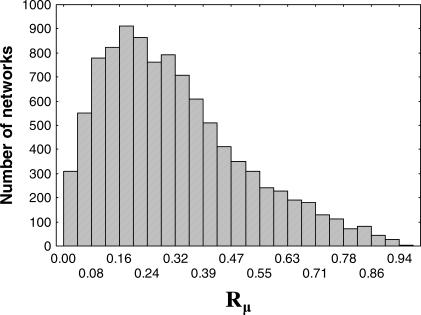
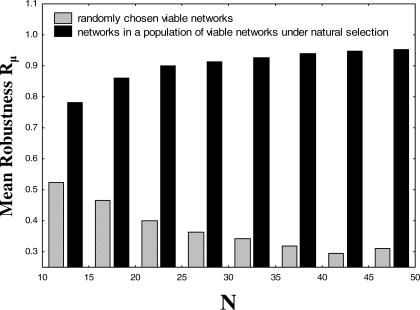
The topology of cellular circuits (the who-interacts-with-whom) is key to understand their robustness to both mutations and noise. The reason is that many biochemical parameters driving circuit behavior vary extensively and are thus not fine-tuned. Existing work in this area asks to what extent the function of any one given circuit is robust. But is high robustness truly remarkable, or would it be expected for many circuits of similar topology? And how can high robustness come about through gradual Darwinian evolution that changes circuit topology gradually, one interaction at a time? We here ask these questions for a model of transcriptional regulation networks, in which we explore millions of different network topologies. Robustness to mutations and noise are correlated in these networks. They show a skewed distribution, with a very small number of networks being vastly more robust than the rest. All networks that attain a given gene expression state can be organized into a graph whose nodes are networks that differ in their topology. Remarkably, this graph is connected and can be easily traversed by gradual changes of network topologies. Thus, robustness is an evolvable property. This connectedness and evolvability of robust networks may be a general organizational principle of biological networks. In addition, it exists also for RNA and protein structures, and may thus be a general organizational principle of all biological systems.
Conflict of interest statement
Figures
Similar articles
-
Circuit topology and the evolution of robustness in two-gene circadian oscillators.Proc Natl Acad Sci U S A. 2005 Aug 16;102(33):11775-80. doi: 10.1073/pnas.0501094102. Epub 2005 Aug 8. Proc Natl Acad Sci U S A. 2005. PMID: 16087882 Free PMC article.
-
The effect of scale-free topology on the robustness and evolvability of genetic regulatory networks.J Theor Biol. 2010 Nov 7;267(1):48-61. doi: 10.1016/j.jtbi.2010.08.006. Epub 2010 Aug 7. J Theor Biol. 2010. PMID: 20696172
-
Relevance of phenotypic noise to adaptation and evolution.IET Syst Biol. 2008 Sep;2(5):234-46. doi: 10.1049/iet-syb:20070078. IET Syst Biol. 2008. PMID: 19045819
-
Evolutionary transitions in controls reconcile adaptation with continuity of evolution.Semin Cell Dev Biol. 2019 Apr;88:36-45. doi: 10.1016/j.semcdb.2018.05.014. Epub 2018 May 19. Semin Cell Dev Biol. 2019. PMID: 29778791 Review.
-
[Progress in research of genetic circuits].Sheng Wu Yi Xue Gong Cheng Xue Za Zhi. 2007 Apr;24(2):460-2. Sheng Wu Yi Xue Gong Cheng Xue Za Zhi. 2007. PMID: 17591282 Review. Chinese.
Cited by
-
Using evolutionary computations to understand the design and evolution of gene and cell regulatory networks.Methods. 2013 Jul 15;62(1):39-55. doi: 10.1016/j.ymeth.2013.05.013. Epub 2013 May 30. Methods. 2013. PMID: 23726941 Free PMC article. Review.
-
Early effects of gene duplication on the robustness and phenotypic variability of gene regulatory networks.BMC Bioinformatics. 2022 Nov 28;23(1):509. doi: 10.1186/s12859-022-05067-1. BMC Bioinformatics. 2022. PMID: 36443677 Free PMC article.
-
A linear reciprocal relationship between robustness and plasticity in homeostatic biological networks.PLoS One. 2023 Jan 26;18(1):e0277181. doi: 10.1371/journal.pone.0277181. eCollection 2023. PLoS One. 2023. PMID: 36701362 Free PMC article.
-
Phenotypic plasticity can facilitate adaptive evolution in gene regulatory circuits.BMC Evol Biol. 2011 Jan 6;11:5. doi: 10.1186/1471-2148-11-5. BMC Evol Biol. 2011. PMID: 21211007 Free PMC article.
-
Algorithms in nature: the convergence of systems biology and computational thinking.Mol Syst Biol. 2011 Nov 8;7:546. doi: 10.1038/msb.2011.78. Mol Syst Biol. 2011. PMID: 22068329 Free PMC article. Review.
References
-
- Ozbudak E, Thattai M, Kurtser I, Grossman A, van Oudenaarden A. Regulation of noise in the expression of a single gene. Nat Genet. 2002;31:69–73. - PubMed
-
- Elowitz M, Levine A, Siggia E, Swain P. Stochastic gene expression in a single cell. Science. 2002;297:1183–1186. - PubMed
-
- Blake W, Kaern M, Cantor C, Collins J. Noise in eukaryotic gene expression. Nature. 2003;422:633–637. - PubMed
-
- Thornhill R, Moller A. Developmental stability, disease and medicine. Biol Rev Camb Philos Soc. 1997;72:497–548. - PubMed
Publication types
MeSH terms
Substances
Grants and funding
LinkOut - more resources
Full Text Sources
