. 2007 Feb 2;3(2):e17.
doi: 10.1371/journal.pcbi.0030017.

Efficiency and cost of economical brain functional networks

Affiliations

Efficiency and cost of economical brain functional networks

Sophie Achard et al. PLoS Comput Biol. .

Abstract

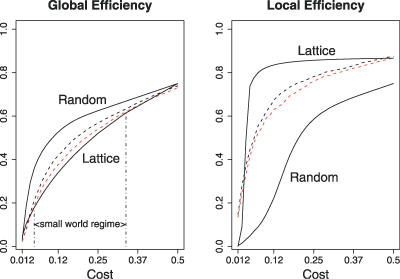
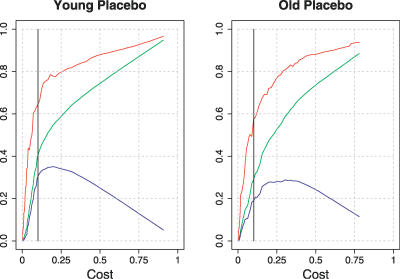
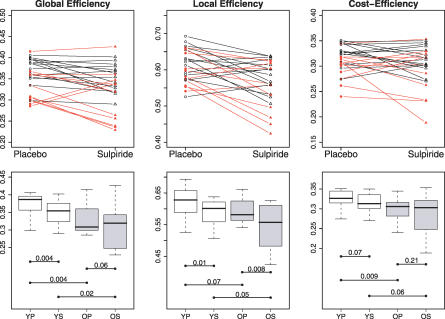
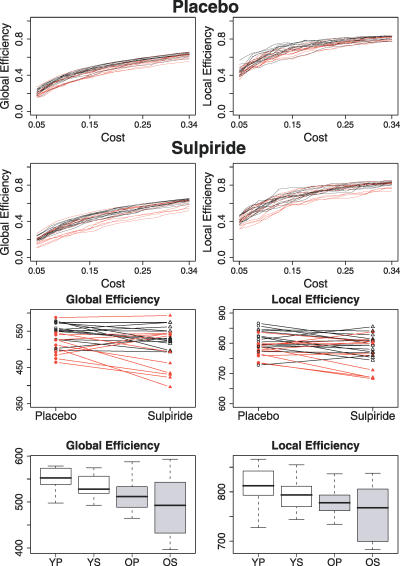
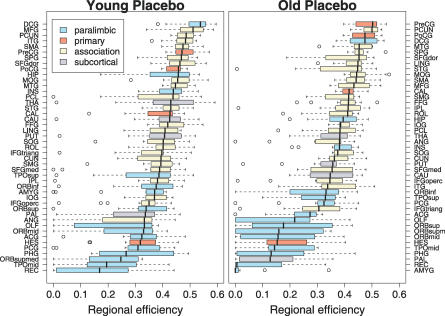
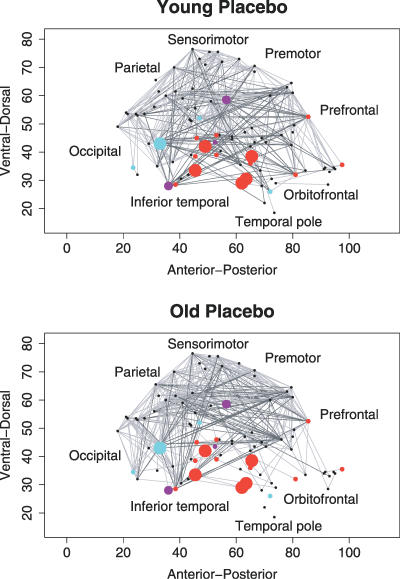
Brain anatomical networks are sparse, complex, and have economical small-world properties. We investigated the efficiency and cost of human brain functional networks measured using functional magnetic resonance imaging (fMRI) in a factorial design: two groups of healthy old (N = 11; mean age = 66.5 years) and healthy young (N = 15; mean age = 24.7 years) volunteers were each scanned twice in a no-task or "resting" state following placebo or a single dose of a dopamine receptor antagonist (sulpiride 400 mg). Functional connectivity between 90 cortical and subcortical regions was estimated by wavelet correlation analysis, in the frequency interval 0.06-0.11 Hz, and thresholded to construct undirected graphs. These brain functional networks were small-world and economical in the sense of providing high global and local efficiency of parallel information processing for low connection cost. Efficiency was reduced disproportionately to cost in older people, and the detrimental effects of age on efficiency were localised to frontal and temporal cortical and subcortical regions. Dopamine antagonism also impaired global and local efficiency of the network, but this effect was differentially localised and did not interact with the effect of age. Brain functional networks have economical small-world properties-supporting efficient parallel information transfer at relatively low cost-which are differently impaired by normal aging and pharmacological blockade of dopamine transmission.


Conflict of interest statement

Competing interests. The authors have declared that no competing interests exist.

Figures

Figure 1
Figure 1. Small-World Properties of Human Brain Functional Networks
Global and local efficiency (y-axis) as a function of cost (x-axis) for a random graph, a regular lattice, and brain networks. For all networks, global and local efficiency increase with cost; the random graph has greater global efficiency than the lattice; the lattice has greater local efficiency than the random graph. On average, over all subjects in each group, young brain networks (black broken lines) and old brain networks (red broken lines) have efficiency curves located between the limiting cases of random and lattice topology. The small-world regime is conservatively defined as the range of costs 0.34 ≤ K ≤ 0.5 for which the global efficiency curve for the old networks is greater than the global efficiency curve for the lattice.
Figure 2
Figure 2. Economical Properties of Human Brain Functional Networks
Efficiency (y-axis) as a function of cost (x-axis) for two individual brain networks: a young subject following placebo (left panel) and an older subject following placebo (right panel). For both subjects, local efficiency (red lines) and global efficiency (green lines) increase monotonically with cost; and cost efficiency (the difference between global efficiency and cost; blue lines) has its maximum value when 0.2 ≤ K ≤ 0.4. The low-cost threshold, K ∼ 0.1, associated with the sparse networks reported in Figures 3 and 5, is shown as a black vertical line in each graph.
Figure 3
Figure 3. Efficiency Measures for Low-Cost Brain Functional Networks, with K ∼ 0.1, in All Participants
(Top row) Within-subject effects of dopamine antagonism (sulpiride 400 mg) on global efficiency (left column), local efficiency (middle column), and maximum cost efficiency (right column): data on younger subjects are denoted by black lines and black triangles, data on older subjects by red lines and red triangles. (Bottom row) Box-plots showing median, interquartile range, and range for global efficiency, local efficiency, and maximum-cost efficiency in each age group after each treatment. Each horizontal line and the associated number represent the p-value of a post-hoc t-test: there were consistent pairwise differences in global efficiency related to age (YP–OP and YS–OS), less consistent age-related differences in cost efficiency (YP–OP), and no significant post-hoc effects of age on local efficiency; however, there were consistent pairwise differences in local efficiency related to drug treatment (YP–YS and OP–OS), and a significant effect of drug on global efficiency in young people (YP–YS).
Figure 4
Figure 4. Efficiency Measures Estimated and Integrated over the Small-World Regime of Network Costs, 0.05 ≤ K ≤ 0.34
(Rows 1,2) Global (left) and local (right) efficiency curves for young (black lines) and older (red lines) people after placebo (row 1) and sulpiride (row 2). (Row 3) Within-subject effects of dopamine antagonism on integrated global efficiency (left) and integrated local efficiency (right): data on younger subjects are denoted by black lines and black triangles, data on older subjects by red lines and red triangles. (Row 4) Box-plots showing median, interquartile range, and range for integrated global efficiency (left) and integrated local efficiency (right) in each age group after each treatment.
Figure 5
Figure 5. Effect of Age on Regional Efficiency
Brain regions ranked in order of decreasing regional efficiency: “hubs” have high regional efficiency and tend to be larger regions of association cortex in both young (left panel) and old people (right panel); “diaspora” have low regional efficiency and tend to be smaller regions of limbic/paralimbic cortex. Each box-plot shows median, interquartile range, and range for individual estimates of regional efficiency in each age group following placebo; boxes are color-coded to differentiate primary sensory or motor cortex (red), unimodal or multimodal association cortex (beige), limbic or paralimbic cortex (turquoise blue), and subcortical nuclei (periwinkle blue).
Figure 6
Figure 6. Anatomical Representation of Brain Functional Networks Highlighting Regional Effects of Age and Dopamine Receptor Antagonism
Brain functional networks for one young person following placebo (top row) and one old person following placebo (bottom row). These networks were constructed by thresholding the individual wavelet correlation matrices to derive sparse networks with equal cost, K ∼ 0.1: regional nodes are shown as dots or circles in a sagittal view of the right side of the brain; strong functional connections are shown as undirected edges between nodes. The size of regional nodes is proportional to the significance of age-related or drug-related reductions in regional efficiency: red nodes, efficiency reduced by older age; blue nodes, efficiency reduced by sulpiride; purple nodes, efficiency reduced by both older age and sulpiride. See Table 2 for anatomical detail concerning locations of significant difference in regional efficiency.

Similar articles

Cited by

References

    1. Strogatz SH. Exploring complex networks. Nature. 2001;410:268–276. - PubMed
    1. Albert R, Barabási AL. Statistical mechanics of complex networks. Rev Mod Phys. 2002;74:47–97.
    1. Sporns O, Chialvo DR, Kaiser M, Hilgetag CC. Organization, development and function of complex brain networks. Trends Cogn Sci. 2004;8:418–425. - PubMed
    1. Salvador R, Suckling J, Coleman M, Pickard JD, Menon DK, et al. Neurophysiological architecture of functional magnetic resonance images of human brain. Cereb Cortex. 2005;15:1332–1342. - PubMed
    1. Watts DJ, Strogatz SH. Collective dynamics of “small-world” networks. Nature. 1998;393:440–442. - PubMed

Publication types

Substances