. 2007 Feb;3(2):e13.
doi: 10.1371/journal.ppat.0030013.

Environmental dimensionality controls the interaction of phagocytes with the pathogenic fungi Aspergillus fumigatus and Candida albicans

Affiliations

Environmental dimensionality controls the interaction of phagocytes with the pathogenic fungi Aspergillus fumigatus and Candida albicans

Judith Behnsen et al. PLoS Pathog. 2007 Feb.

Abstract

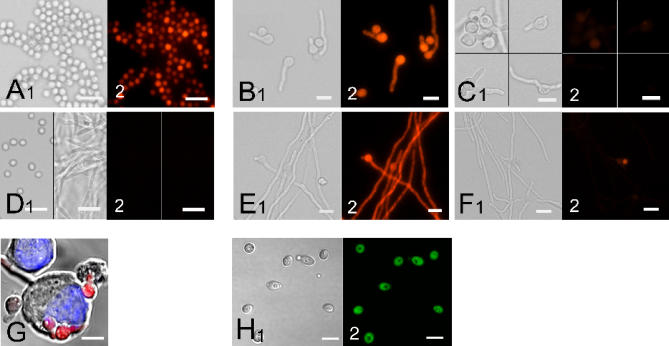
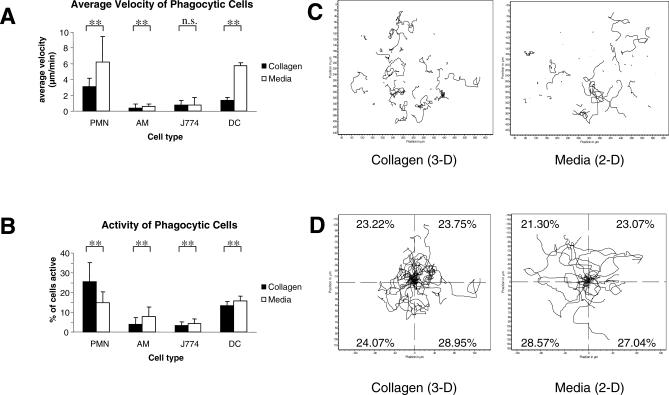
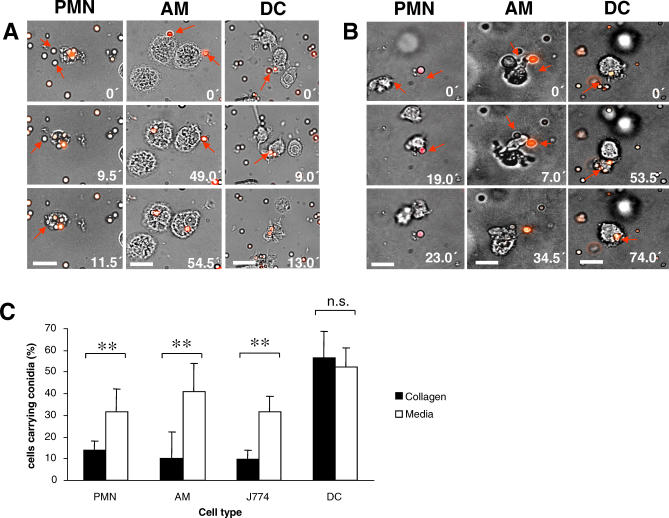
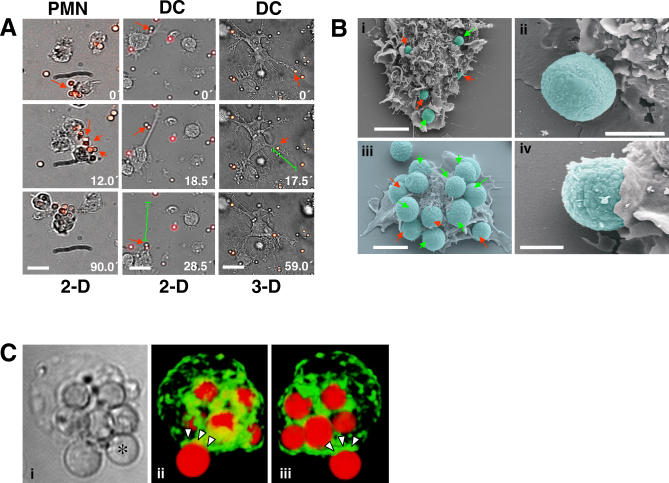
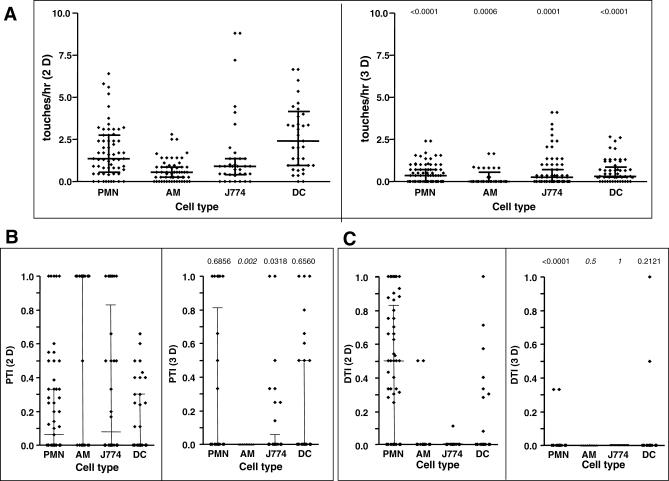
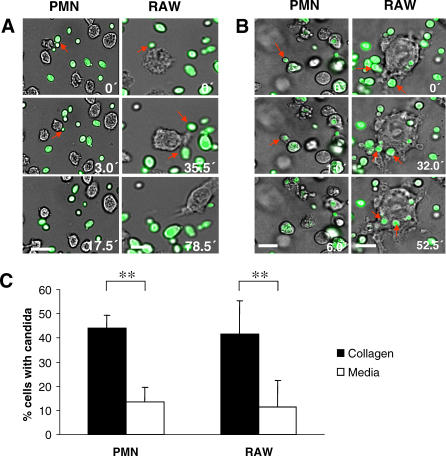
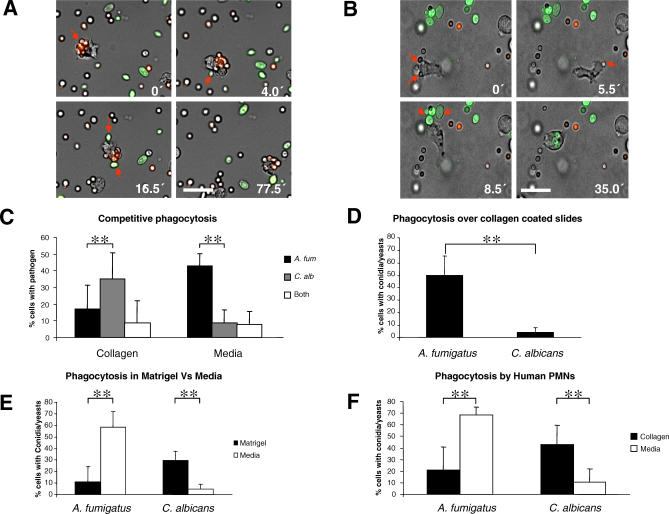
The fungal pathogens Aspergillus fumigatus and Candida albicans are major health threats for immune-compromised patients. Normally, macrophages and neutrophil granulocytes phagocytose inhaled Aspergillus conidia in the two-dimensional (2-D) environment of the alveolar lumen or Candida growing in tissue microabscesses, which are composed of a three-dimensional (3-D) extracellular matrix. However, neither the cellular dynamics, the per-cell efficiency, the outcome of this interaction, nor the environmental impact on this process are known. Live imaging shows that the interaction of phagocytes with Aspergillus or Candida in 2-D liquid cultures or 3-D collagen environments is a dynamic process that includes phagocytosis, dragging, or the mere touching of fungal elements. Neutrophils and alveolar macrophages efficiently phagocytosed or dragged Aspergillus conidia in 2-D, while in 3-D their function was severely impaired. The reverse was found for phagocytosis of Candida. The phagocytosis rate was very low in 2-D, while in 3-D most neutrophils internalized multiple yeasts. In competitive assays, neutrophils primarily incorporated Aspergillus conidia in 2-D and Candida yeasts in 3-D despite frequent touching of the other pathogen. Thus, phagocytes show activity best in the environment where a pathogen is naturally encountered. This could explain why "delocalized" Aspergillus infections such as hematogeneous spread are almost uncontrollable diseases, even in immunocompetent individuals.


Conflict of interest statement

Competing interests. The authors have declared that no competing interests exist.

Figures

Figure 1
Figure 1. Fluorescence of A. fumigatus and C. albicans Strains Under Different Growth Conditions
A transgenic strain of A. fumigatus expressing DsRed2 under the control of the isocitrate lyase promoter (acuDp) was generated. To investigate the intensity of fluorescence as well as the dependency of the transgene expression on the carbon source, A. fumigatus was cultivated in AMM containing either glucose (A, C, and F) or ethanol (B, D, and E) as the sole carbon source. Different developmental stages were analyzed by light (panels 1) and fluorescence microscopy (panels 2). Resting conidia were derived from sporulating cultures on AMM agar plates containing glucose (A). Conidia were incubated in AMM for 7 h and 16 h to yield germlings (B and E) and hyphae (C and D), respectively. Identically treated wild-type conidia/hyphae are shown in (D). Fluorescence was observed irrespective of the carbon source in resting conidia. By contrast, germlings and hyphae only showed fluorescence when grown on ethanol. To test whether phagocytosis could activate the acuD promoter, we observed conidia germinating within macrophages 6 h after phagocytosis by J774 macrophages (G). An overlay is shown of the transmission light image, a DAPI stain for the nucleus (blue) and the red fluorescence of germinating conidia (G). To obtain green fluorescent C. albicans yeast cells, a number of cells were stained with the green cytoplasmic dye CFSE. A transmission light image (H1) and a fluorescence image (H2) of a fresh preparation of CFSE+ C. albicans yeast cells are shown. Bar = 5 μm.
Figure 2
Figure 2. The Migration of Phagocytic Cells in 2-D and 3-D Environments
Unstimulated cells (except J774 cells, which were stimulated overnight with 2.5 U/ml interferon-γ before use) were embedded along with A. fumigatus conidia within 3-D collagen matrices or within a 2-D liquid based chamber, and cell movements were recorded for 2 h by time-lapse video microscopy. The migration of 40 to 60 individual cells for each cell type was quantified by computer-assisted, single-cell tracking. (A and B) The average velocity (in μm/min) (A) and activity (percentage of migrating cells at a given time point) (B) were calculated from the tracks and are shown here as a comparison between different cell types. Data represent the average of three independent experiments. (C) Representative tracks of 40 PMNs were analyzed in a 3-D collagen matrix or in a 2-D media-based system. (D) The same cell tracks as depicted in (C) have been redrawn to artificially start at the center of the graph, and each individual step in each track was analyzed for its length and orientation within the four quadrants. This made it possible to measure the distance of all steps that were made into each quadrant. The numbers indicate the percentage of the total distance covered by all tracked cells in each of the four quadrants in 3-D and 2-D systems, showing almost random migration (perfect random migration would result in 25% distance in each quadrant). **, p < 0.01; n.s., not significant. Error bars represent standard deviation (SD).
Figure 3
Figure 3. Phagocytosis of A. fumigatus Conidia by Different Phagocytes Is Dependent on the Dimensionality of the Environment
(A) A pure fraction of immune cells and conidia was incorporated in a 2-D liquid-based system and subjected to time-lapse video microscopy. Panels show ingestion of conidia (marked by red arrows) by PMNs, AMs, and DCs. All cells were imaged over a period of 3 h. (B) Image sequences from PMNs, AMs, and DCs shown with A. fumigatus conidia in a 3-D collagen matrix. The left column time series displays the interaction of a red A. fumigatus conidium (indicated by red arrow) with a PMN and the latter's inability to ingest or drag the conidium despite contact. The middle column shows the unsuccessful interaction of an AM over a period of 2 h. The right column shows the efficient uptake of four conidia by a DC during a 3-h period. Bar = 25 μm. (C) A histogram quantitatively showing the influence of the environment (3-D, solid bar; 2-D, white bar) on the phagocytic ability of different cell types. The number of cells that had internalized conidia was counted 30 min after the start of imaging. The data represent the average of the percentage of cells internalizing conidia from three independent experiments, representing a total of 433 DCs in collagen, 356 DCs in media, 77 AMs in collagen, 229 AMs in media, 706 PMNs in collagen, 458 PMNs in media, 367 J774 cells in collagen, and 212 J774 cells in media. *, p < 0.05; **, p < 0.01; n.s., not significant. Error bars indicate SD.
Figure 4
Figure 4. Dragging Is a Major Interaction Type of DC or PMN with Conidia of A. fumigatus
(A) Time series from videos of A. fumigatus conidia and PMNs and DCs in 2-D and in 3-D systems show dragging as an alternative way of interaction between phagocytes and A. fumigatus conidia. The conidia are dragged by the PMNs in the form of a cluster. DCs are able to drag conidia over several micrometers (shown in green). Bar = 25 μm. (B) Electron microscope images of DCs (i) and (ii) and PMN (iii) and (iv) are shown interacting with conidia, which were pseudocolored blue to enhance contrast. Dragging and ongoing phagocytosis as seen in time-lapse imaging is evident in the form of several conidia attached to a single DC or PMN (shown here in green arrows), as well as in the process of being incorporated into (indicated by red arrows) a single DC or PMN in the high resolution electron microscopy image (Bar = 5 μm). (ii) shows an attached conidium to a DC, and (iv) shows a conidium being phagocytosed by a PMN (Bar = 2μm). (C) Attached and internalized conidia associated with the same PMN. PMNs were fixed and permeabilized during interaction with DsRed conidia. Subsequently, cells were stained with Alexa 488 labeled phalloidin. Two-color confocal microscopy was used to obtain a z stack covering the entire cell thickness. Shown is the transmission light image (i) as well as two views of a voxel rendering of composite red (fungus) green (actin) fluorescence images. (ii) corresponds to the same view as (i) and (iii) corresponds to a 180-degree rotation in the plane of the paper showing that five conidia are entirely covered by actin cytoskeleton pockets, while the sixth conidium is in the process of being phagocytosed as depicted by actin protrusions (arrowheads). These protrusions correspond to those depicted in (B) (iv). The conidium marked with an asterisk is not visible in the fluorescence image due to the loss of fluorescence. Also refer to Video S9.
Figure 5
Figure 5. The Physical Interaction of A. fumigatus Conidia and Several Phagocytes Is Strongly Influenced by the Dimensionality of the Environment
(A) Column scatter plots showing the number of contacts between phagocytes and conidia per hour in 2-D and 3-D environments. Each dot represents all observable contacts of an individual cell with conidia within a given video. As observation times for single cells vary greatly due to movements in and out of focus, values have been normalized on the average number of contacts per hour. Individual conidia touching cells as detected in (A) were subsequently followed for their fates. This could be simple release, dragging, or phagocytosis. Dots in (B) show the rate of conidia that have been successfully phagocytosed relative to the number of conidia that have been touched by a cell (PTI). Each dot represents the value for one single cell. All cell types have been investigated for their PTI in 2-D and in 3-D environments. (C) DTI values for the four cell types in 2-D and in 3-D environments. Evaluation of the DTI is analogous to the evaluation of the PTI with dragging as the physical interaction scored. Significance values (indicated over 3-D figures) have been obtained using the Mann-Whitney nonparametric U-test except where written in italics. Here the Mann-Whitney U-test was not applicable, and p-values were derived from the Wilcoxon rank sum test. Alternately, the Mann-Whitney U-test was performed after assigning arbitrary small values to the 0 entries. This yielded results similar to those of the Wilcoxon rank sum test (p-values not shown). The horizontal bars in each column scatter plot indicate median. The vertical lines represent interquartile ranges.
Figure 6
Figure 6. Phagocytosis of C. albicans by PMN and RAW Cells Is Enhanced in 3-D Environments
(A) Image sequences from videos with PMN and RAW cells interacting with C. albicans in a 2-D system. Bar = 25 μm. The images show several contacts between the cells and the fungus (red arrows) without any ingestion or dragging. (B) Time series showing efficient uptake of C. albicans (red arrows) by PMN and RAW macrophages. Image sequences from videos with PMN and RAW cells interacting with C. albicans in a 3-D collagen matrix. Bar = 25 μm. Interactions were observed over a period of 3 h. (C) Quantitative representation of the effect of the environment on the phagocytosis of C. albicans by PMN and RAW cells in 2-D and in 3-D environments. The number of cells that had internalized C. albicans cells was counted 30 min after the start of imaging. The data represent the average percentage of cells internalizing yeasts from three independent experiments, representing a total of 241 PMNs in collagen, 187 in media, and 141 RAW macrophages in collagen, 97 in media. **, p < 0.01. Error bars represent SD.
Figure 7
Figure 7. Phagocytosis of A. fumigatus and C. albicans Is Dependent on the Dimensionality of the Environment
PMNs were incorporated along with A. fumigatus conidia and C. albicans yeast cells in the same system (2-D or 3-D), and the interactions were observed over a period of 3 h. (A) A PMN selectively taking up and dragging A. fumigatus conidia despite several contacts with C. albicans yeasts in a 2-D liquid system. Bar = 25μm. (B) Time series of a PMN selectively taking up three C. albicans cells despite touching at least four A. fumigatus conidia in 3-D (red arrows). Bar = 25 μm. (C) Quantitative representation of cells with internalized A. fumigatus conidia or C. albicans yeast cells or both in 2-D or 3-D systems. Data represent the average percentage of cells carrying conidia and/or yeasts from three independent experiments, representing 140 PMNs in collagen and 217 PMNs in media with error bars denoting SD. **, p < 0.01. (D) Quantitative comparison of the percentage of PMNs internalizing conidia or yeasts over collagen coated slides. The graph represents data from three independent experiments. Error bars denote SD. **, p < 0.001. (E) Average percentage of PMNs internalizing A. fumigatus or C. albicans in Matrigel (solid bar) and in media (open bar). Data represent the average from three independent experiments. Error bars indicate SD. **, p < 0.001 for both pathogens in 2-D and in 3-D environments. (F) Average percentage of PMNs derived from peripheral human blood with internalized conidia or yeasts in 2-D or 3-D systems. Data represent the average of cells taken from three healthy blood donors, each analyzed for all four conditions. Error bars indicate SD. **, p < 0.001.

Similar articles

Cited by

References

    1. Brakhage AA. Systemic fungal infections caused by Aspergillus species: Epidemiology, infection process and virulence determinants. Curr Drug Targets. 2005;6:875–886. - PubMed
    1. Pfaller MA, Diekema DJ. Rare and emerging opportunistic fungal pathogens: Concern for resistance beyond Candida albicans and Aspergillus fumigatus . J Clin Microbiol. 2004;42:4419–4431. - PMC - PubMed
    1. Marr KA, Carter RA, Crippa F, Wald A, Corey L. Epidemiology and outcome of mould infections in hematopoietic stem cell transplant recipients. Clin Infect Dis. 2002;34:909–917. - PubMed
    1. Wald A, Leisenring W, van Burik JA, Bowden RA. Epidemiology of Aspergillus infections in a large cohort of patients undergoing bone marrow transplantation. J Infect Dis. 1997;175:1459–1466. - PubMed
    1. Sole A, Morant P, Salavert M, Peman J, Morales P. Aspergillus infections in lung transplant recipients: Risk factors and outcome. Clin Microbiol Infect. 2005;11:359–365. - PubMed

Publication types

Substances